EUR/USD
4 hour

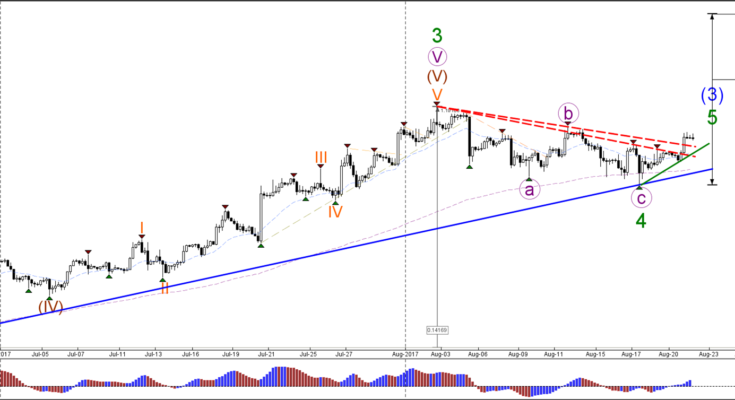
The EUR/USD is breaking above resistance trend lines (dotted reds) of a bull flag continuation chart pattern of a wave 4 (green) correction. This bullish break above resistance (red) could confirm the end of wave 4 and start of wave 5.
1 hour

The EUR/USD seems to be building a 5 wave extension within wave 3 (purple). The wave 4 (brown) pullback should not retrace deeper than the 50% at 1.1780 otherwise the wave 4 is invalidated. A break above the bull flag chart pattern confirms the continuation of the wave 3 (purple) towards the Fib targets of wave 3 vs 1.
USD/JPY
4 hour

The USD/JPY has bounced again at the key support zone (green lines). The bullish bounce could see price expand a wave B (brown) correction via an ABC (orange) flat.
1 hour

The USD/JPY broke above the resistance trend line (dotted orange) of the downtrend and is now showing a potential bounce. A bullish break above resistance (red) would confirm the potential wave 3 (purple) whereas a bearish break below support (green) would invalidate it.
GBP/USD
4 hour

The GBP/USD could have completed a 5th wave (purple) within wave 1 (red). A bullish bounce at the support trend line (blue) could see price move higher towards the Fibonacci retracement levels of wave 2 (red).
1 hour

A GBP/USD seems to be building a large correction via WXY (purple).

