EUR/USD
4 hour

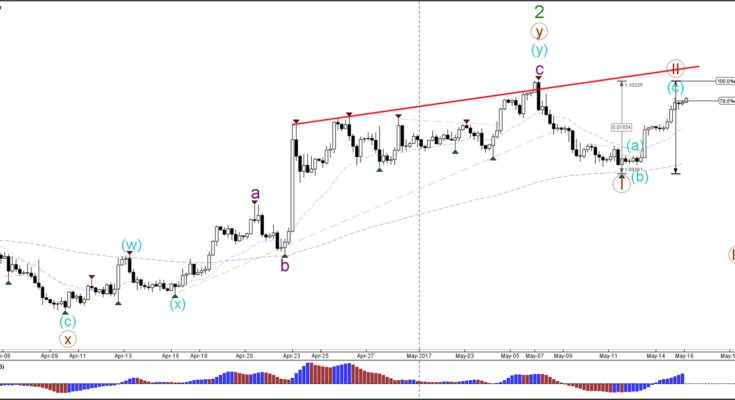
The EUR/USD is challenging the 78.6% Fibonacci level of wave 2 (brown) and the round resistance level of 1.10. A bearish reversal could complete wave 2 (brown) and start a wave 3 whereas as bullish break above the 100% level would invalidate wave 2.
1 hour

The EUR/USD could be building an ABC (blue) zigzag within wave 2 (brown) if price stays below the 100% level.
USD/JPY
4 hour

The USD/JPY is struggling to break above the resistance Fibonacci levels of wave B (brown) because the bearish break below support (dotted blue) could indicate the start of a larger bearish ABC correction (brown).
1 hour

The USD/JPY will need to break below the support trend line (green) before a wave C (brown) continuation becomes more likely. A break above resistance (orange) could see price challenge the 78.6% Fib.
GBP/USD
4 hour

The GBP/USD stopped at the 61.8% Fibonacci level of wave 2 (green). A break below the support trend lines (green) could start a larger bearish correction whereas a break above resistance (orange) could see price testing the 78.6% Fib.
1 hour

The GBP/USD break above the 100% Fib invalidates the wave 2 (green) structure.
Â

