EUR/USD
4 hour

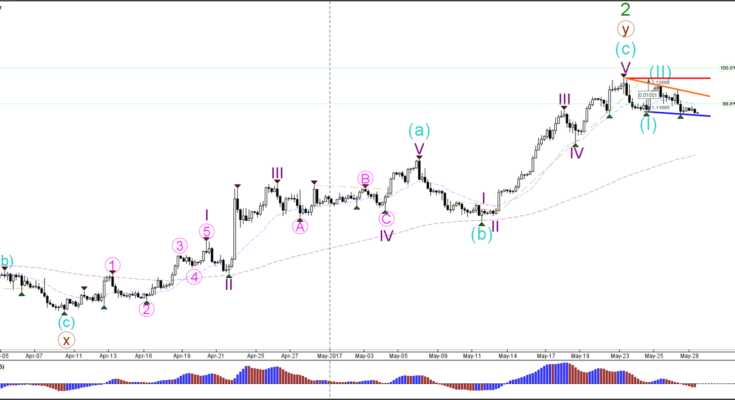
The EUR/USD failed to break above the 1.1250 resistance zone so far which is a major decision zone for either a bullish breakout or a bearish reversal. The critical level is the 100% Fibonacci at 1.1268: a break above this resistance top invalidates wave 2 (blue) whereas a break above 1.13 invalidates another bearish wave 2 (green). A bearish reversal, however, could see price break below support (blue).
1 hour

The EUR/USD seems to have completed a wave 2 (blue) but a break below the support trend line (blue) is needed before a wave 3 (blue) could unfold. A break above the resistance line (red) invalidates the current bearish wave structure. At the moment the EUR/USD is either building a bull flag continuation chart pattern or the start of a bearish reversal, which will depend on the direction of the breakout.
GBP/USD
4 hour

The GBP/USD broke below the support trend line (dotted green) and reached the 161.8% Fibonacci target of wave 3 (blue). Price could still fall towards lower Fib targets if price can extend its decline.
1 hour

The GBP/USD could be building a 5 wave (orange) expansion within wave 3 (blue). The wave 4 (orange) retracement Fibonacci levels could act as resistance but a break above the 61.8% makes 4th wave unlikely.
USD/JPY
4 hour

The USD/JPY is in a triangle formation with support (blue) and resistance (orange) nearby. A bearish break could see price fall towards the Fibonacci retracement levels of wave B (blue).
1 hour

The USD/JPY could be in wave 4 (purple) unless price breaks above the bottom of wave 1 (orange line).
Â

