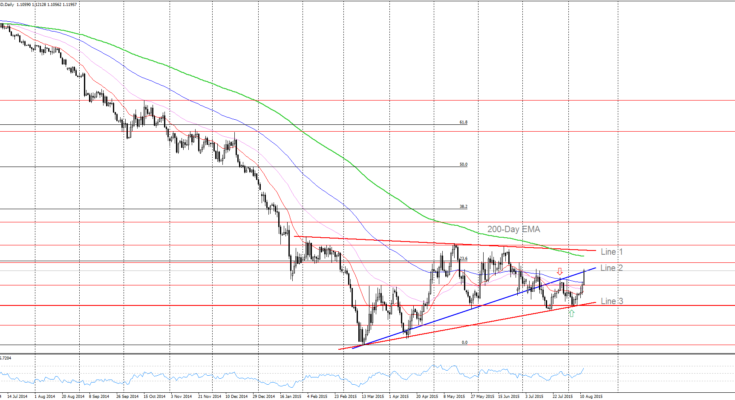
EUR/USD (daily chart as of August 12, 2015) has been trading higher since it hit the 1.0850 support level on August 4 (green arrow on chart). This is a confluence of support levels, including the support line connecting the March 13 low, April 13 low, and July 20 low (line 3 on chart).

Current price is testing the uptrend line connecting the March 13 low and May 27 low (line 2 on chart), which acted as a resistance line on July 27 (red arrow on chart). Note that current price is approaching a medium-term resistance line connecting the February 3 high, May 15 high, and June 18 high (line 1 on chart). As we can see that the pair is now trading in a larger triangle range between line 1 (or 200-day EMA) and line 3.
Watch closely the price action against line 2 for the following trading sessions. If the pair clears this important resistance, it could trade higher to test the 200-day EMA and line 1. If line 2 remains as resistance, the pair could decline to test line 3 again. Note also that the 200-day EMA is turning flat, and approaching line 2 and line 1, which makes a potential resistance confluence.
Support levels:
S1: Line 3
S2: 1.0660 (April 21 low)
S3: 1.0460 (March 31 low)
Resistance levels:
R1: Line 2
R2: 200-day EMA and Line 1
R3: 1.1680 (January 21 high)
Post by Diane Ming, Contributing Author of InvestingTeacher.com. She is an Affiliate Member of the Market Technicians Association (MTA).
Upcoming event risks:
Thursday August 13, 8:30am – USD Retail Sales m/m and Unemployment Claims
Thursday August 13, Tentative – EUR Greek Government Debt Crisis Vote
Thursday August 13, 6:45pm – NZD Retail Sales q/q
Friday August 14, 2:00am – EUR German Prelim GDP q/q
Friday August 14, 8:30am – CAD Manufacturing Sales m/m
Friday August 14, 8:30am – USD PPI m/m
Friday August 14, 10:00am – USD Prelim UoM Consumer Sentiment
In our latest podcast, we ask: Will they or won’t they? We talk about the Fed and also falling oil and silver.
Follow us on Stitcher.


