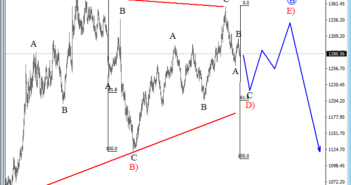
Good morning traders. Today, let’s take a quick peek at Gold and its mid-term development.
We see Gold trading in a big, choppy, overlapping and sideways price action since the start of 2016. This slow visible structure resembles an Elliott wave triangle correction. A triangle correction is a complex pattern with five legs, with each leg having three more sub-waves. On the daily chart of Gold we see price trading within leg D) of this triangle pattern, which may see more weakness in the next few days, ideally to 61.8% Fib. Level that comes in around 1205 July swing low.
For more detail Elliott wave technical analysis on Gold plus other markets, such as 10 year US note, AudUsd, Bitcoin and Crude Oil, check our NEW video at:Â https://goo.gl/FM1MGv


