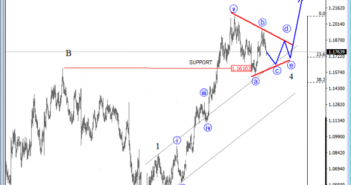
The daily chart of EURUSD shows us a five-wave bullish impulse in the making within higher degree wave C). We see a choppy and slow price movement for the last three months as part of a pullback, that can unfold as a EW triangle correction. Wave 4 is usually more complex, then wave 2 and can take longer to fully develop, so gains can still be put on hold for awhile.
EURUSD, Daily

Regarding the 4h chart, where we see a recent decline to around 1.1712 level as leg c is the third leg of a EW triangle pattern. Here the former swing low of red sub-wave b) at 1.1713 level can offer support and push the price higher into leg d.
All being said, a breach above the 1.1960 level will indicate a completed EW triangle correction and more upside to follow, into leg 5.

A Triangle is a common 5-wave pattern labeled A-B-C-D-E that moves counter-trend and is corrective in nature. Triangles move within two channel lines drawn from waves A to C, and from waves B to D. A Triangle is either contracting or expanding depending on whether the channel lines are converging or expanding. Triangles are overlapping five wave affairs that subdivide 3-3-3-3-3.
Triangles can occur in wave 4, wave B, wave X position or in some very rare cases also in wave Y of a combination
EW triangle pattern:


