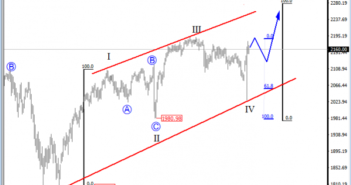
Stocks turned strongly lower this summer but only into a temporary three wave retracement as we expected. It was a wave IV pullback that appears completed now, following the recent bounce from 2025 level up to 2160. This is a strong reaction that suggests higher prices into wave V that belongs to an ending diagonal pattern, so despite the current bullish momentum, we expect a top to be formed near the 2200/2300 area.
S&P500, Daily

On the lower time frame, we can see that E-mini S&P500 recovered sharply after the drop to the 2030 area, where the market shows now signs of a completed three wave decline in wave IV, from the August highs.
Notice that thecurrent leg up is much stronger than the previous decline, so we believe that a bigger uptrend is back in bullish mode, ideally in wave V, that will be looking to reach new all-time highs. In the short-term however, be aware of a corrective set-back; ideally into wave B flat correction, back to that broken channel that can become a good support next week.
S&P500, 4H

 The ending diagonal is a special type of motive wave that occurs primarily in the wave 5 position when price has moved too far and too fast. Some ending diagonal triangles appear in the C wave of an ABC correction. In all cases, the ending diagonal terminates the move of larger patterns. They consist out of five waves, with each having three more sub-waves.
Basic Ending Diagonal Pattern:


