Good day traders! Today we are going to take a better look at S&P500.
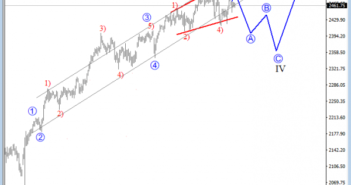
S&P500 is trading bullish since November 2016, when wave II was completed. From there the price continued strongly higher into wave III which can be in its late stages with the current expanding diagonal in sub-wave five which may reachits top at 2500/30 area. Afterwards a three-wave correction into wave IV can follow.
S&P500, Daily

Regarding the 4h chart, we see E-mini S&P500 trading in a complex upward move within wave five, the final leg of an expanding diagonal as shown on a daily chart. We can see that the price made a new sharp reaction higher overnight, which is now a confirmation that the minor wave c of Y is in progress. Ideally, the current rally will search for a top near the 2500 region.
S&P500, 4H


