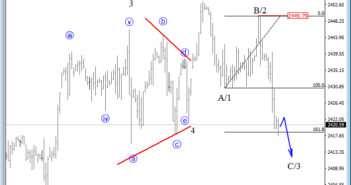
The updated chart of S&P500 is displaying a three wave correction in action, with the price currently trading in wave C. The previous wave B looks to have found a top at the 2449 level, which means the current weakness is wave C/3, that is now already trading near the 2417 region. Ideally we will see even more weakness.
S&P500, 4H

USDJPY is in clear bullish market, away from 108.82 level, where a big correction ended. That said, the current rise above 111.73 region can be red wave i), that can see a limited upside and make a new three wave pullback into the following wave ii). The corrective wave ii) can later search for support around the 111.73 level.
USDJPY, 1H


