S&P500
Good Morning traders!
Last trading day of the month. Stocks are still in sideway consolidation with a bullish outlook. The calendar is reserved for the GDP figures from EU, US and Canada with US personal consumption data. Let’s begin with an overall stock index view to get a sense of the general direction. According to this count we are still in the risk on mode. S&P500 is trading in a complex correction, named a triangle, which seems to be in the final stages as of the current price action and unfolded sub-waves. We know that a triangle is a continuation pattern, so after its completion more upside could follow in red wave 5) to around 2.180-90 area.
S&P500, 1H

EURGBP
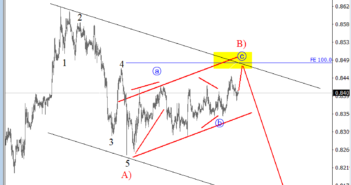
On the intraday chart of EURGBP we are observing a temporary correction in red wave B) taking place, that seems to be in final stages, specificaly in wave c with some room left for higher prices. Ideally, the turning point could then happen around the 850 mark.
EURGBP, 1H


