Good Morning traders !
On the 1h chart of NZDUSD we are observing an idea of a double zig-zag taking place, with the price currently trading in final wave Y. If the labbeling is on point, than we can expect a little more upside, probably towards 0.715 area, where former wave 4 can act as a resistance and a turning point lower.
NZDUSD, 1H

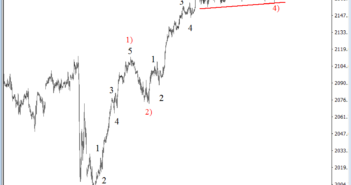
On the intraday chart of S&P500, we are looking at a nice uptrend that is taking place, with the price now in a complex correction wave 4). This complex correction seems to be a triangle pattern, a continuation pattern that can after its completion push the price higher.
S&P500, 1H


