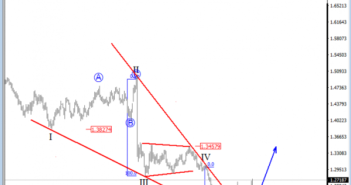
GBPUSD fell sharply to the downside, a few weeks back, which we see as the final wave V that touched the lower trendline of a wedged pattern, known also as a diagonal triangle. If we are correct and the price really did post wave C) lows, then the recent upward action may be the start of a new bullish rally. But if the price breaks beneath the current wave V lows, then wave V of C) may still be in the making with lower prices to follow.
GBPUSD, Daily

Regarding the 4h chart, GBPUSD bounced at the end of last week with a nice and strong move, which looks like an impulsive reaction that took us above 1.2674. As of the current price action we can say that red wave 3) is now completed, and a possible corrective wave 4) could be in motion towards the 38.2 or 50.0 Fibonacci ratio with sub-wave A in final stages. If the price trades as expected, then we could be in for more gains in the weeks ahead.
GBPUSD, 4h


