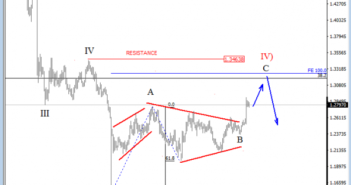
GBPUSD is moving sideways after the pair recovered from that 1.1500 spike low where we see a completed wave three, so the current structure is an ongoing fourth wave which can see more upside as we think that the market can be in an A-B-C structure. That said, wave B triangle looks completed and the current rally may be wave C, which can see a limited upside around 38.2.
GBPUSD, Daily

On the 4h chart we can see cable making a strong rise away from 1.2364, clearly in an impulsive fashion which can see an extension up to 1.3140 area for wave C. That said, the recent slow price activity was sub-wave 4), which may have already found a base and the current intra-day rally may be the start of sub-wave 5) of three.
GBPUSD, 4H


