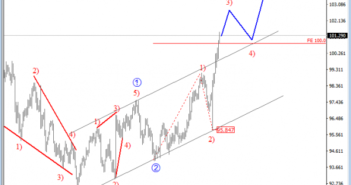
USD index was in a big sideways pattern unfolding since the start of 2015. The slow and overlapping price action with a personality of a contra-trend movement that now looks completed, based on a five wave movement up from the 91.90 level that can be a leading diagonal in wave 1-circled. If that’s the case, then the recent pullback was sub-wave 2) that appears completed at 95.84, near the lower support line of an upward channel. As such, the trend remains in bullish mode now for wave three that has reached the first target near 101.00, but ideally, the dollar will move much higher in the weeks ahead.
USD Index, Daily

On the lower time frame, we can see that USD index fell sharply during US elections two weeks back, butthe  market quickly realized that Trumps victory may not be so bad for the US and the dollar itself since he supports the idea of higher interest rates. As such, the market turned up as US election results were coming out. We have seen a nice turn from 95.90, where rising trendline and 61.8% Fib. retracement turned out to be a very good support. We can see a strong recovery now, clearly in an impulsive fashion which we believe belongs to a much bigger uptrend. In the short-term however, we can see a corrective set-back before the market may see 102.00/102.50 area.
USD Index, 4H
 USD Index


