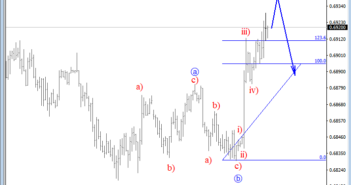
Good day traders! Let’s have a look at AUDUSD, its 4-hour movement and NZDUSD.
AUDUSD is clearly bearish, unfolding a five-wave drop within red wave 1) with sub-wave 5 in progress. We know that waves 1-3 and 5 are all impulses, which means they must contain five legs for a complete pattern. In our case we now see four of them visible within wave 5, so one more push to the downside can follow with a Fibonacci projection target of 200.0.
That being said, once wave 5 of 1) fully unfolds, a new bigger three-wave recovery may come in play.
AUDUSD, 4H

Now let’s take a look at NZDUSD and its 1h chart.
NZDUSD is trading higher, ideally in a three-wave correction. We see blue wave c in motion that can search for resistance near the 0.6550 region. But if the price keeps getting stronger, thena  second resistance region can be found around 0.7000 level.
NZDUSD, 1H


