This is Part 3 of my 3-part review of The Conference Board’s economic indicators. Monday I reviewed the lagging indicators, confirming that 2014 has been the best year for economic growth since the financial crisis, although sluggish wage growth and rising consumer debt (aided by artificially low interest rates) presented some concerns. Yesterday I reviewed the coincident indicators and found that the U.S. economy is growing and adding jobs, although the mix of jobs is still too tilted toward part-time positions, and consumer spending is benefiting from an unsustainable rise in transfer payments. This article will cover The Conference Board’s leading economic indicators. Overall, the analysis indicates that momentum in the U.S. economy should extend into early 2015, but conditions will likely slow by mid-year as the Fed gradually removes the Quantitative Easing training wheels.
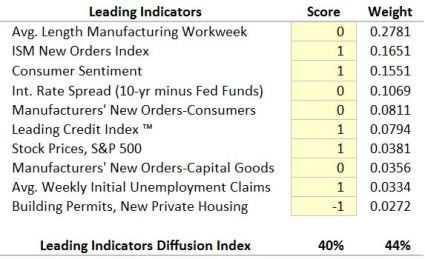
The leading indicators are depicted in the table below, along with my -1, 0 or +1 rankings and the weights assigned by The Conference Board. The equally- and Conference Board-weighted diffusion index scores of +40% and +44%, respectively (based on a possible range of -100% to +100%), show that the U.S. economy will most likely sustain its recent momentum into the first half of 2015. A detailed review of each leading indicator follows below.

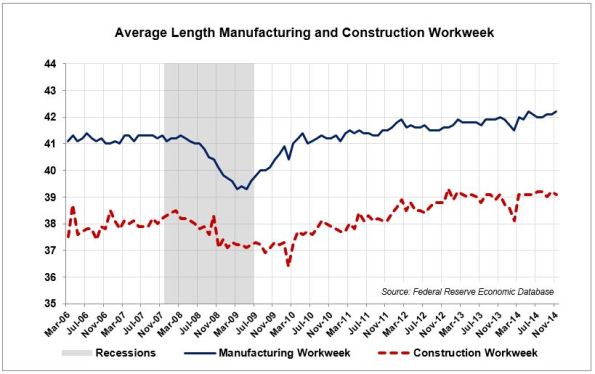
The most heavily-weighted component is the Average Length of the Manufacturing Workweek (weight = 27.8%), shown below with the Average Length of the Construction Workweek. The manufacturing workweek has exceeded 42 hours for the first time in many years. The gradual rise in the series is mirrored in the length of the construction workweek. On the surface, these would appear to be purely positive developments . . .

. . . except, as shown below, the U.S. economy has shed an astounding 5 million manufacturing jobs and almost 2 million construction jobs in the last 10-15 years. Ouch! Given that context, I can only rank this indicator zero.

