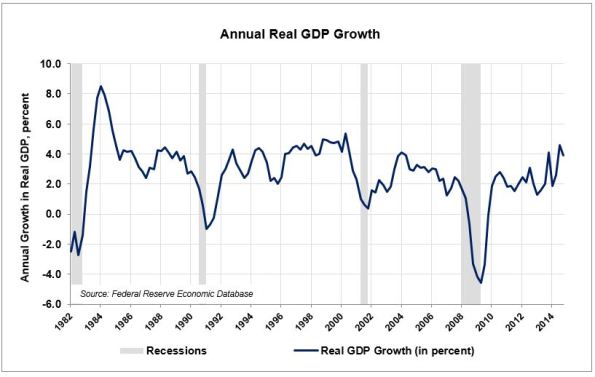
It’s the time of the year to reflect on the direction of the economy. For the past several years I have examined each individual component of The Conference Board’s Lagging, Coincident and Leading Economic Indicators and created my own diffusion index by ranking each indicator -1, 0 or +1. I have found that this method produces accurate forecasts of future economic conditions. In 2013 I predicted a continuation of sluggish growth ahead of virtually everyone else (link here), and in 2014 I reversed that call and predicted faster growth (link here), which also turned out to be correct. Thus far in 2014 GDP growth has been higher than any year since the 2008 financial crisis, which can be seen in the following graph.
Â

Â
I’ll break this year’s forecast into 3 parts. Part 1 will cover The Conference Board’s 7 Lagging Indicators, which help us look back and understand how economic activity evolved over the past 6-12 months (I will cover the Coincident and Leading Indicators later this week). I find that the Lagging Indicators are most useful for corroborating previous forecasts and identifying the main factors that contributed to growth in previous periods.
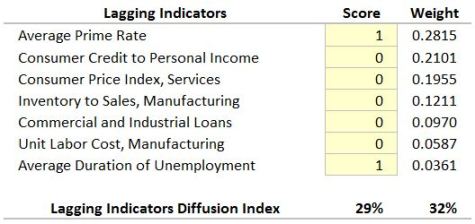
The following table shows my rankings for each lagging indicator. While no indicator is flashing a negative signal (corresponding to a score of -1), I scored most of them zero rather than +1, as the evidence strongly suggests that GDP growth in 2014 was dependent upon artificially low interest rates and further increases in consumer debt loads, which were already high.
Â

Â
Sluggish wage growth and an elevated services CPI (which tends to rise in the early stages of an economic slowdown) cast further doubt on whether 2015 can match or exceed the growth we’ve seen in 2014. The diffusion index scores of 29% and 32% (equally weighted and using The Conference Board’s weights, respectively) reflect my view that although economic growth was positive, economic momentum remains surprisingly tepid. The economy may have difficulty sustaining its recent performance all the way through 2015. A detailed analysis of each lagging indicator follows below.

