Here’s a brief review of the charts from a few of last week’s economic data releases.
JOLTS
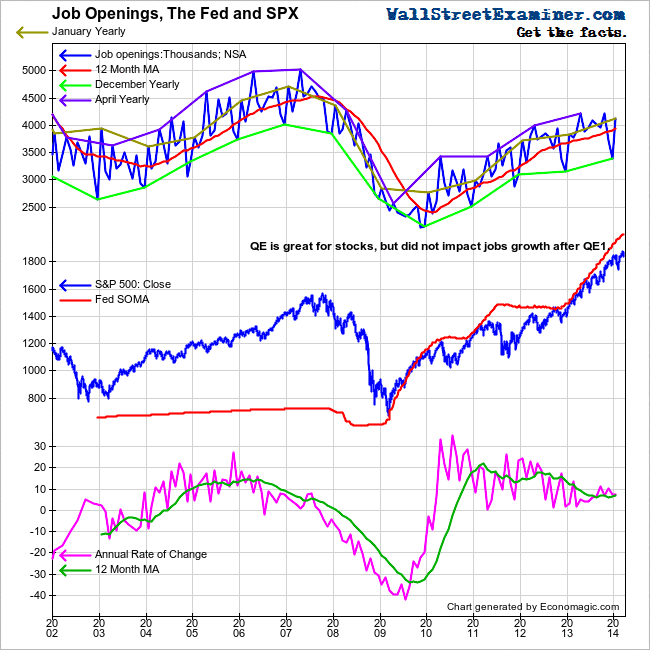
The Labor Department’s Job Openings and Labor Turnover Survey reported 4.12 million job openings (actual- not seasonally adjusted) in January,  a 7.4% increase over January 2013. The growth rate has ranged from 6% to 11% over the past 6 months which is somewhat slower than the 2011-2013 growth rates. January’s job postings rose 21.7% over December’s, which is consistent with a typical January. The January 2013 gain was the same. The 10 year average gain for January is 18.6%.
It is striking that the annual growth rate was stronger during the period when the Fed was in a long QE pause in 2011-12. The growth rate has slowed since QE 3 began late in 2012.

JOLTS- Job Openings And Labor Turnover- Click to enlarge
Initial Jobless Claims
The Labor Departments weekly initial jobless claims headline number came in at 315,000 last week, which was better than the economists’ consensus guess of 335,000. The actual, not seasonally adjusted number was 302,000 which was 4.6% less than the same week a year ago. The week to week change was a drop of 15,600, which was slightly less than the same week last year. The rate of improvement had been mostly around 10% from 2010 through Q3 of 2013. That rate has slowed since Q4 of 2013 to the 0 to 5% range.

Initial Unemployment Claims- Click to enlarge
A comparison of initial claims on an inverse scale chart alongside of the S&P 500 illustrates the bubbly nature of stock prices over the past 18 months.

Initial Claims vs. Stock Prices- Click to enlarge
Retail Sales
The headline number for February retail sales of a monthly gain of 0.3% was better than the economists’ consensus guess of a 0.2% gain. However, the actual, not seasonally adjusted data wasn’t that great. February retail sales of $385.1 billion were up just 1.5% year over year. The month to month change of a decline of 1.2% was worse than the February 2013 drop of 0.4% and also worse than the 10 year average for February of a decline of 0.1%.

