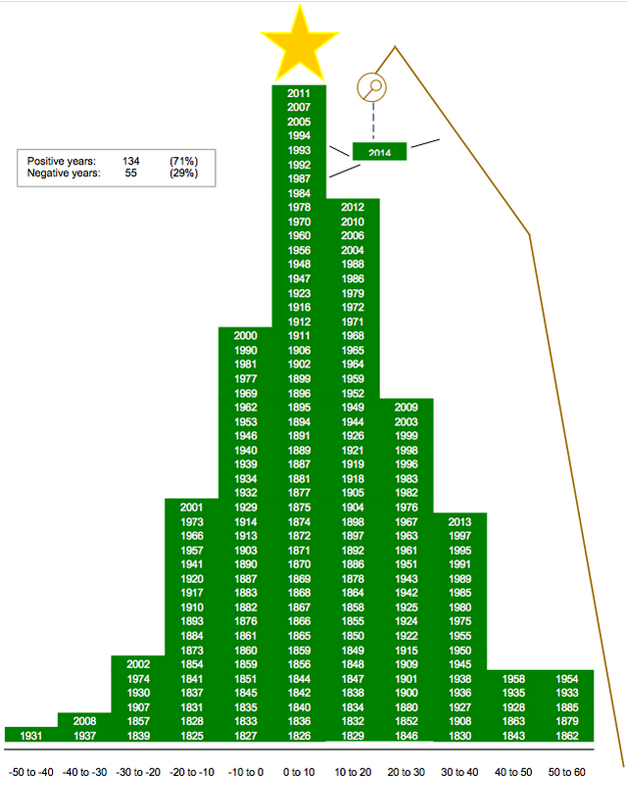
Near the end of December last year, Sterne Agee’s chief market technician Carter Braxton Worth put together this nifty little “Christmas Tree†showing how “the market†(well, the US market, anyway) has performed since the year 1825. To do so, he used data from Roger G. Ibbotson and Yale University up until 1895, then used the DJIA until 1927 and, finally switched to the S&P 500 from 1928 forward.

US Stock Prices % Total Return
His chart shows that the US stock market has produced a January 1 to December 31 gain in 134 (71%) of those years and failed to produce a calendar year gain in 55 (29%) of those years. This is pretty close to what I wrote in my book, Bringing Home the Gold, 25 years ago when I said the market goes up about 2/3 of the time and down only about 1/3 of the time.
Yet, during all those years, there was always some bad news that frightened ordinary investors away from the market. That’s why it doesn’t pay to be short the market just because Iran is seeking, with the help of some too eager-for-a-deal, any-deal, U.S. negotiators, to build a nuclear bomb and delivery system or because the U.S. unemployment rate reaches 10% or, indeed, because the Japanese bombed Pearl Harbor. (That was December 7, 1941. You’ll notice that the markets rose in the 20-30% range in both 1942 and 1943.)
The Christmas Tree is really just a standard distribution chart, and its lessons should be heeded. The first of those is that you never “know†when to be short or out of the market based upon the external news scenario. In fact, as I recently wrote, “Bull markets climb a wall of worry.†If investors weren’t nervous they’d all buy all the time and pretty soon no one would sell — until, of course, that inevitable moment when a small boy tugs at mommy’s skirt and says, “But the emperor isn’t wearing any clothes,†after which all hell would break loose.
A second lesson is that you cannot predict the future from the past, though you can see parallels. I can find no instance in this chart where there were back-to-back losses within the same distribution range that were greater than 10% — of course, if you were down 9% one year, 12% the next and 22% the next (as happened in 2000, 2001 and 2002) you could be forgiven for thinking the markets were no place for mere mortals — just in time to see a 28% rise in 2003 and up markets for the next four years as well.
The point is, if you remain well-diversified among a number of asset classes you will never do as well as today’s market darling or sector but you will make considerably more year in and year out. Yet, when we are in a down market, people panic and assume the market must keep going down the next x number of months or years, as well. So they sell, typically at or near the bottom and don’t re-enter the arena until the news is good and they see that other friends and neighbors are re-entering as well.
