<<< Read Part 1:Eurozone Banks Ready To Implode: It’s Bad, You KnowÂ
This article represents Part 2 on the comparative performance of the 20 largest U.S. and European commercial banks since 2001. (The full paper is available for download from the Social Science Research Network: SSRN.) In yesterday’s post I showed how European banks were lagging U.S. banks in terms of revenue and loan growth, and how both sets of banks had not increased their allowance for loan loss accounts proportionately in the post-crisis period, despite much higher levels of impaired loans.
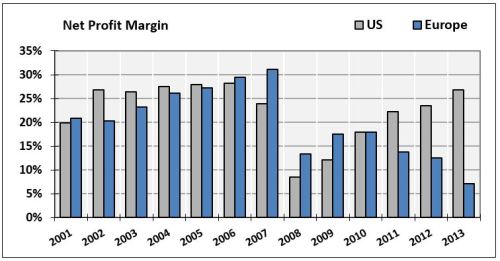
Today’s post will compare these banks’ profitability, capital ratios, effective tax rates, payouts to shareholders and overall solvency. The graph below depicts the average net profit margin for both sets of banks 2001-2013. Margins trend higher every year through 2006, plunge during the crisis years, and begin recovering through 2010. Afterwards, U.S. banks’ average margins trend back up to their pre-crisis levels, but European banks’ margins trend down for the next 4 years, all the way to a vapor-thin 7% by fiscal 2013.

If we measure profitability as return on equity (ROE), the results are similar. U.S. banks’ average ROE post-crisis has been higher than its pre-crisis average, while European banks’ steadily contracting ROE (2.5% in fiscal 2013) reflects just how desperate their situation really is.

With U.S. banks’ average profit margins back to their pre-crisis levels and ROE consistently higher, one might expect banks to pay taxes at the same rate as they did pre-crisis — but that would occur only in a world that made sense.
In our new, banker-centric universe, “profits up, tax rates down†seems to be one part of the new normal even Jamie (“help, we’re under attackâ€) Dimon would approve of. No sign of regulators ganging up on banks here.


