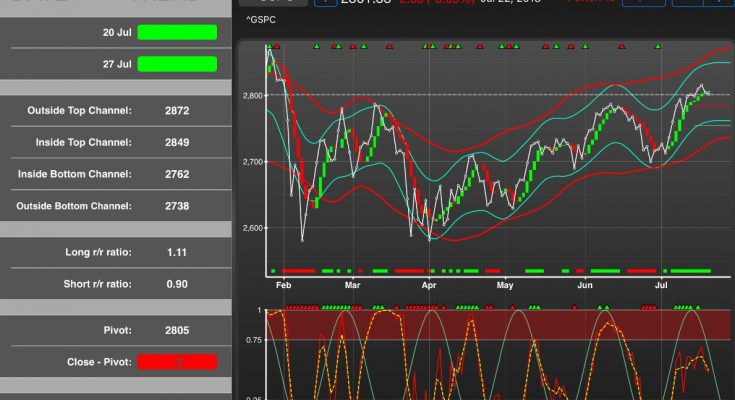
This week’s abbreviated analysis comes courtesy of OddsTrader – the only app that harnesses the power of Hurst Channels and cycles, providing traders with accurate price targets and trading signals since 2011. While the focus here is the daily chart, the app also provides intraday and weekly signals and targets.

Two weeks ago we speculated that given the overbought nature of certain short-term market breadth indicators, the SPX will have trouble breaking above 2800. This proved to be the case and, although the trend is still up, the index couldn’t finish the week above key resistance. The difference however, is that this time the same indicator that was flashing overbought is nearing oversold territory, which could trigger another run up within the next few days.
Here’s the relevant data from OddsTrader: the projected trading range for next week for SPX is 2762 – 2849. The average cycle duration is 12 days, and the average swing gain/loss is 57 points.
The risk/reward oscillator is in neutral territory, reflected in the tight spread between the long and short risk/reward ratio. The close is 3 points above the pivot line, and the Swing Buy signal triggered from 2719 is still in effect:

The newly released version of OddsTrader for Android can be found here.

