Gold- Bearish divergence amid US dollar revival
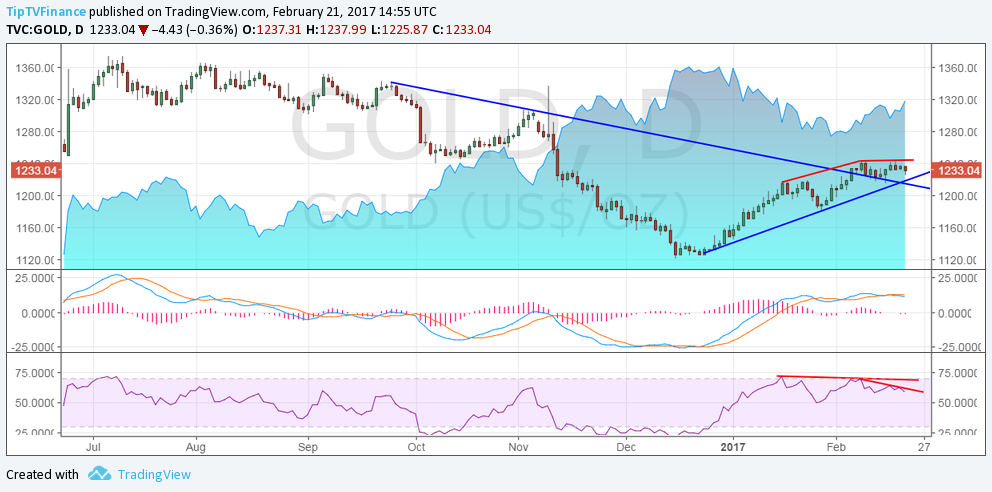
Daily chart (shaded area represents USD index)

- Gold’s retreat from $1244 (Feb 17 high) to $1230 levels today has put the focus back on the bearish price RSI divergence. The daily MACD has turned bearish as well.
- The metal appears on track to test the descending trend line support around $1215 levels.
- Prices could breach the trend line support and test the psychological level of $1200 as the US dollar has turned higher.
- Moreover, a break below $1215 would also mark a breach of the rising trend line… that would signal the rally from the December low of $1122 has topped out.
FTSE 100 – Re-test of Oct 2016 high
Daily chart (shaded area represents GBP/USD)
- The February high stands at 7329.6 levels, which is just a few points short of the record high of 7354.1 (Jan 16 high).
- Meanwhile, the February high on the RSI is well short of the level seen in January when prices hit the record highs.
- RSI’s underperformance coupled with loss of bullish momentum as represented by the daily MACD suggests the index could re-test the October high of 7130.
- Bullish scenario – A rebound from the smaller rising trend line followed by a break above the February high of 7329 would open doors for a test of 7400 levels.Â
