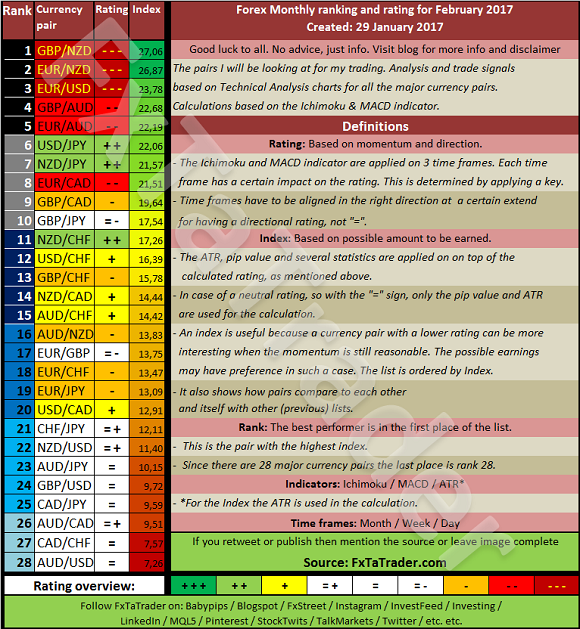
The Top 10 of the Ranking and Rating list for the coming month shows the following stronger currencies being well represented for going long: NZD(3X) followed by the USD(2X) with the AUD(2X). The weaker currencies are the EUR(4X) with the GBP(4X) followed by the JPY(3X).
A nice combination for coming month may be e.g:
- GBP/NZD with the USD/JPY
- EUR/NZD with the GBP/AUD
- EUR/USD with the NZD/JPY
Some of the pairs in the Top 10 comply for a longer term trade based on the Technical Analysis (TA) of the Weekly and Monthly chart. For the coming month these seem to be: GBP/NZD, EUR/NZD, EUR/USD, GBP/AUD, GBP/CAD and GBP/JPY. For more details read both of my articles where the relevant Charts and Tables are provided.
______________________________________
Ranking and Rating list
Analysis based on TA charts for all the major currency pairs. All the relevant Time Frames will be analyzed and the ATR and Pip value will be set.

Â
______________________________________
For analyzing the best pairs to trade looking from a longer term perspective the last 12 months Currency Classification can be used in support.
This was updated on 29 January 2017 and is provided here for reference purposes:Â
Strong:Â USD, JPY, NZD. The preferred range is from 6 to 8.
Neutral:Â AUD, CAD, CHF. The preferred range is from 3 to 5.
Weak: EUR, GBP. The preferred range is from 1 to 2.
When comparing the 12 months Currency Classification with the pairs mentioned in the Ranking List above some would then become less interesting. On the other hand these pairs are at the top of the list partly also because of their volatility. It seems best to take positions for a short period then and take advantage of the high price movements.
______________________________________
Currency Score Chart
The Currency Score analysis is one of the parameters used for the Ranking and Rating list which is published also in this article. The Currency Score is my analysis on the 8 major currencies based on the technical analysis charts using the MACD and Ichimoku indicator on 3 Time Frames: the Monthly, Weekly and Daily. The result of the technical analysis is shown below.
