- The best sector across ADRs is utilities.
- The top countries are Canada and Brazil.
The average score across our universe of ADRs is 42.40. The average score over the past four and eight weeks is 46.63 and 46.74, respectively (see score trends a bit below).
The average ADR is trading -27.5% below its 52 week high, -2.05% below its 200 dma, has 3.72 days to cover held short, and is expected to grow its EPS by 10.9% in the coming year.
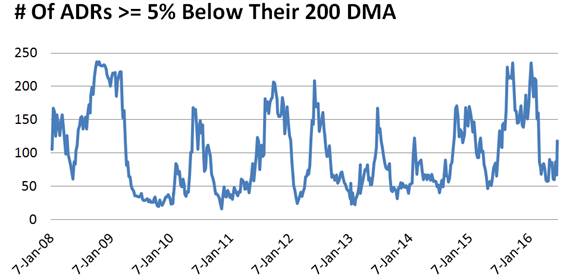
The following chart will be familiar to long-term readers. We usually break it out at turning points. The chart shows the number of ADRs in our ADR universe that are trading at least 5% below their 200 DMA. An increase in this measure is bearish. Historically, the best opportunity to buy risk occurs when the reading is north of 200.

The next chart shows historical average score across our ADR universe. It’s helpful in visualizing where we stand in moves up and down. Scores are retracing, however, unlike the above chart, they’re not doing so off an extreme reading. Typically, when average scores get to 40 or below, it’s an actionable opportunity to buy risk. We’ll continue to update you on this measure in the coming weeks.

The following table highlights the top and bottom scoring ADRs in our coverage.

Utilities (SBS, ELP) are the strongest scoring sector in ADRs. Basic materials (SNP, ECA, GOLD, SID, SUBCY, YPF, YZC), healthcare (GWPH, AMRN, FWP), and services (HMIN, JOBS, OMAB, UGP) also score better than average. Technology scores in line with the average ADR. Financials, consumer goods, and industrial goods score below average.

North America (ECA, BCE) and Latin America (SBS, BAP, ELP, UGP, OMAB, CIB) are the best zones. North America, Latin America, and UK/Ireland (GWPH, AMRN, ICLR, BP) are the best regions. Canada (ECA, BCE, TU), Brazil (SBS, ELP, UGP, CBD, SID), Bermuda (GSOL), Chile (AKOB), and Norway (SUBCY, STO) are the top scoring countries.


