Video length: 00:09:23
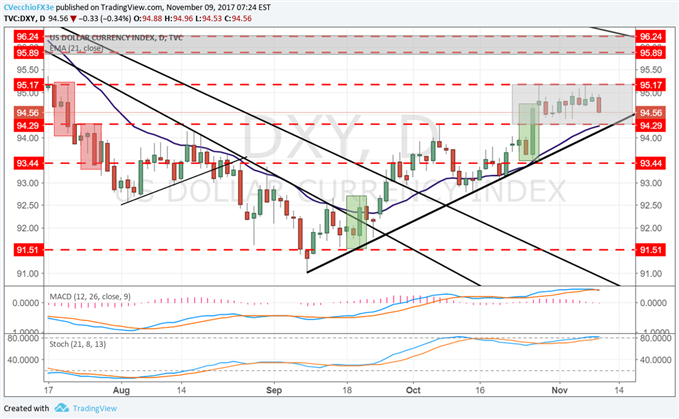
During a quiet like this one, traders may begin to experience déjà vu, that is, each day seems like a carbon copy of the last. Such has been the case for the US Dollar, as it remains within the two-week range carved out since the end of October. The range, between 94.29 and 95.17, has little reason to break one way or the other, given the lack of drivers on the immediate horizon.
Chart 1: DXY Index Daily Timeframe (July to November 2017)

For now, particularly in the run up to the Thanksgiving holiday in the United States in two weeks time, the prospect of tax reform legislation will be the key source of influence for the US Dollar. Speculation around the Fed is lower down the totem pole as a major influence; markets have been pricing in a 100% of a 25-bps rate hike in December for the past two weeks.
As it were, the DXY Index remains between two key levels, 94.29 (the neckline of the inverse head & shoulders pattern, as well as the July 26 bearish outside engulfing bar high) and 95.17 (the July 20 bearish outside engulfing bar high). Given price action today across individual USD-pairs, in particular EUR/USD, USD/CAD, and USD/JPY, it seems the most likely outcome in the near-term would be for a test of the 94.29 range low in DXY.
Â

