Among the many promises made by President Elect Trump, one was to declare China a currency manipulator on his first day in office. Besides the logistical difficulties of doing so without a Treasury Secretary in place, there are the minor difficulties of what the data indicate (I know, I know, facts seem of little import these days, but what the heck). In addition to the legally defined concerns Brad Setser has raised, I think it is useful to see how China’s currency using a commonly used measure of currency misalignment.
Recall, in recent work with Yin-Wong Cheung and Xin Nong, we found that that as of 2011, the yuan was not misaligned using the Penn effect allowing for nonlinearity. Now 2011 is a while ago, but we were constrained by the availability of internationally comparable price level data in the Penn World Tables (PWT).
Our findings using World Bank World Development Indicators (WDI) data up to 2014 indicated substantial overvaluation (in both 2011 and 2014); since the 2011 estimates of misalignment differ so much between the PWT and WDI datasets, that suggests an alternative check to determine misalignment. I use the the Big Mac index as of July 2016, and WDI PPP estimates of per capita income for 2016.
Using a sample of 55 countries (Data [XLSX]), I estimate the following regression:
r = 0.630y + 0.158y2
Adj-R2 = 0.12, SER = 0.273. bold face denotes significance at 5% msl, using Huber-White standard errors.
The use of the quadratic specification is justified in recent, following Hassan (2016, JIE
).
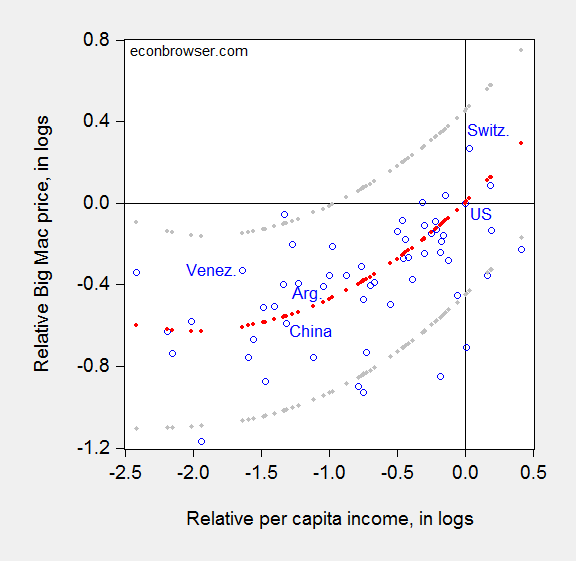
In Figure 1, I show the scatter plot for July 2016, and the curve fitted through the data, forcing the intercept to go through the origin, thereby forcing the US dollar to have no misalignment against itself.

Figure 1: Log relative dollar price of Big Mac against dollar price of US Big Mac (July 2016) versus log relative per capita income in PPP terms (2016 estimates); regression fit from quadratic specification (red dots), and 90% prediction interval (gray dots). Source: Economist, World Bank World Development Indicators, and author’s calculations. Data [XLSX]
