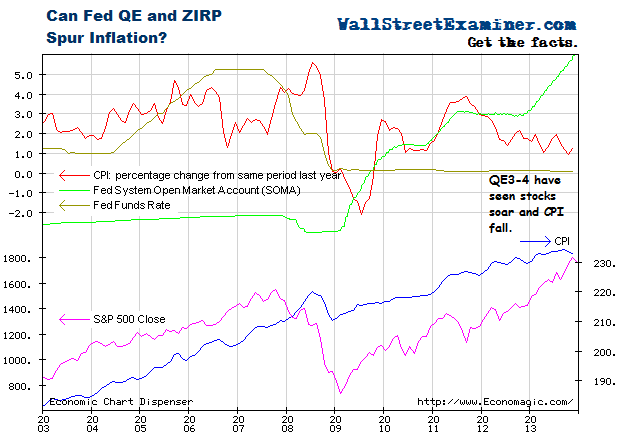
The headline Consumer Price Index for November was 0%, which was below the consensus guess of economists of 0.1%. Since the onset of QE3 and 4 in November 2012, CPI has trended from an annual rate of 2% to now 1%. With the latest CPI data now posted, it’s an opportune time to go back and look at several other economic indicators, including key measures adjusted for inflation to show the growth rate in real constant dollar terms.

Fed Policy and CPI – Click to enlarge
Last week I posted a chart of PPI showing that the Fed’s policies, far from boosting inflation, which is the Fed’s aim, are actually deflationary. The CPI shows more of the same. The latest round of QE accompanying a Fed Funds rate near zero have seen the CPI go negative month to month and approach 1% year to year.
The Fed is like a rat chasing its tail. The more money it prints and the more income it steals from America’s middle class and elderly savers, the less inflation it gets. The less inflation it gets, the more it is encouraged to print more money and keep ordinary Americans from earning a dime on their savings. In fact, the Fed is content to force many elderly Americans to consume their savings and be forced on to food stamps and Medicaid. Oh, sorry. No food stamps for you! Congress has cut those benefits to save a pittance on the deficit while restoring billions in military cuts.
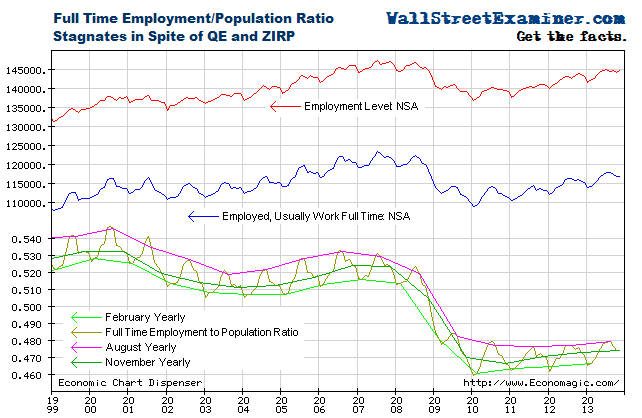
The Fed’s primary goal of QE and ZIRP is for stocks to rise so that all that newly created wealth (AKA fictitious capital) in the hands of the top 7% of the income strata will trickle down to the masses. After nearly 5 years of this shit, we are still waiting for that to happen, as a growing number of Americans constantly fall out of the labor force and those who remain see their wages stagnate.  Five years of pumping  free money to banks and leveraged speculators have left us with still only 47.5% of Americans having full time jobs.

Only 48% of Americans Work Full time – Click to enlarge

