Following futures positions of non-commercials are as of October 1, 2024.10-year note: Currently net short 1,143.9k, up 118.6k.(Click on image to enlarge)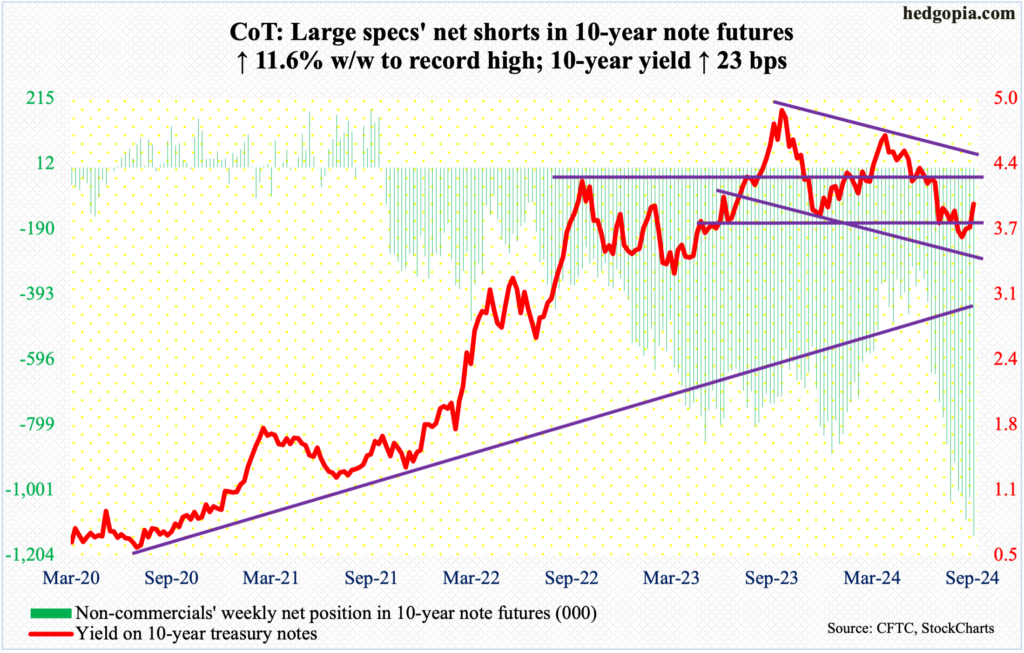
Yet another record high in non-commercials’ net shorts in 10-year note futures! These traders are obviously positioned for higher rates, and they are nailing it of late.The 10-year yield peaked at five percent in October last year. A lower high of 4.74 percent was posted in April, followed by 4.49 percent early July. In the week to April 23, non-commercials were holding 353,920 net shorts, followed by 307,692 in the week to June 11. Rates in the meantime continued lower, and these traders persistently raised their holdings, crossing a million by the week to August 20.Rates eventually bottomed at 3.6 percent on September 17. This week, the 10-year added 23 basis points to 3.98 percent, and more gains are possible in the sessions/weeks ahead. There is horizontal resistance between 4.2 percent and 4.3 percent; then there is trendline resistance from October last year at 4.4 percent. If these levels get hit, non-commercials are likely to cash in, and that in and of itself can put the 10-year under pressure.30-year bond: Currently net short 96.6k, down 56k.(Click on image to enlarge)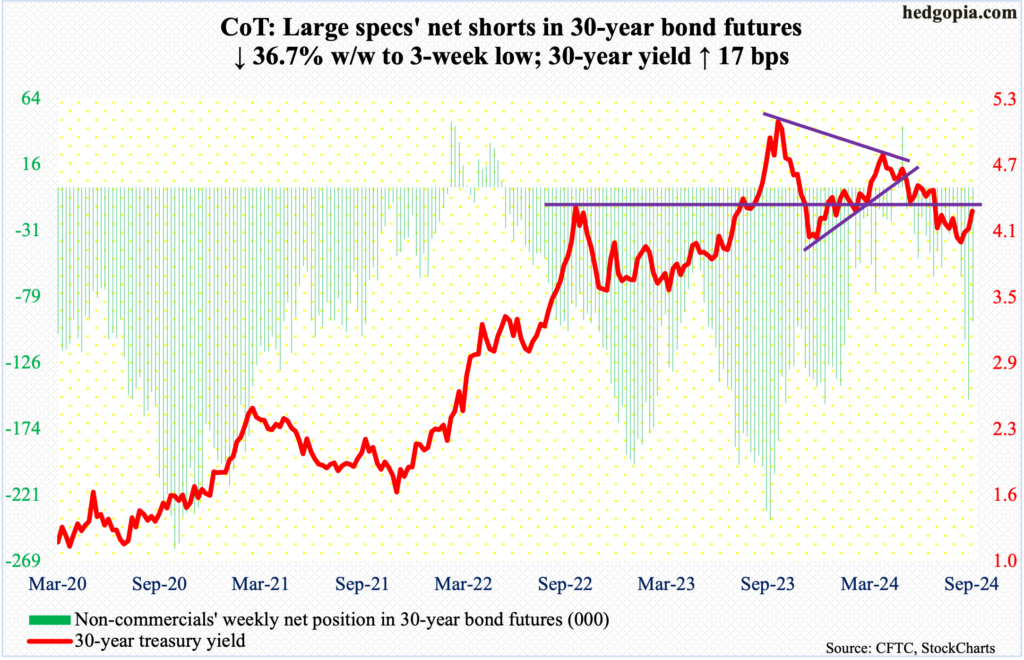
Major US economic releases for next week are as follows.The NFIB optimism index (September) is on schedule for Tuesday. Small-business optimism dropped 2.5 points month-over-month in August to 91.2 – a three-month low. March’s 88.5 was the lowest since December 2012.Thursday brings the consumer price index (September). In the 12 months to August, headline and core CPI increased 2.5 percent and 3.2 percent respectively. In June and September of 2022, they were growing at four-decade highs of 9.1 percent and 6.6 percent respectively.The producer price index (September) and University of Michigan’s consumer sentiment index (October, preliminary) are scheduled for Friday.On a 12-month basis, headline and core wholesale prices rose 1.7 percent and 3.3 percent in August – a six-month low and a three-month high, in that order.Consumer sentiment in September firmed up 2.2 points m/m to 70.1 – a five-month high. March’s 79.4 was the highest since July 2021.WTI crude oil: Currently net long 135.2k, down 36.9k.(Click on image to enlarge)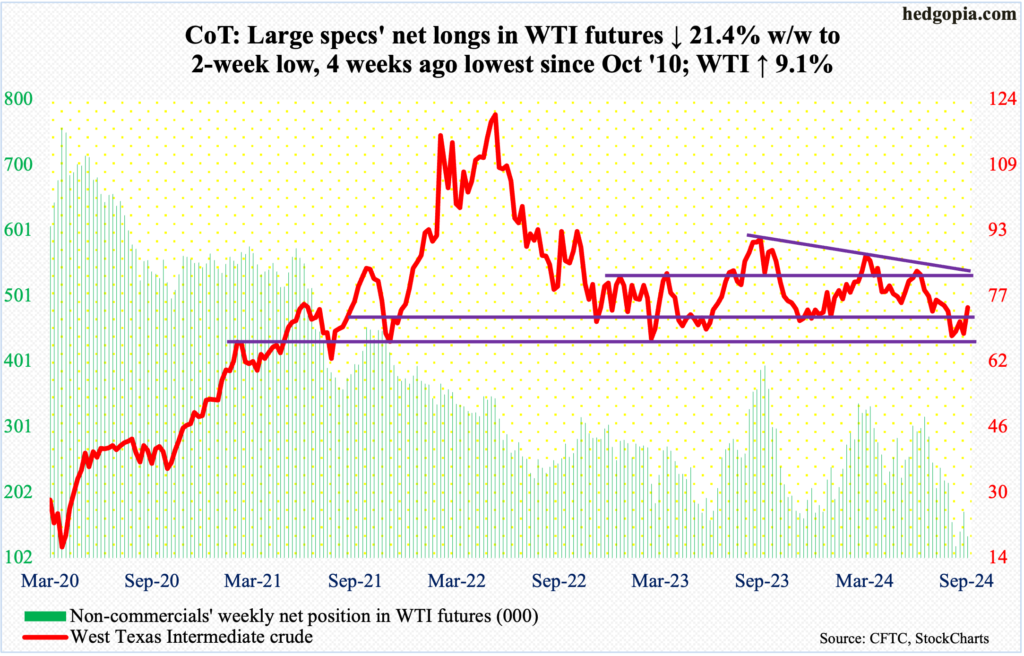
The oil market found itself amid several potentially price moving variables, most prominent of which was how things evolved between Israel and Iran. Speculation was growing that Israel could retaliate Iran’s attack using ballistic missiles by striking Iranian oil facilities. Worse, Iran could create disruptions in the Strait of Hormuz. West Texas Intermediate crude surged 9.1 percent to $74.38/barrel.Oil bulls completely ignored an OPEC+ ministerial decision to continue with a plan to start raising output by 180,000 barrels per day from December.This week’s rally pushes the crude back into a well-established range between $71-72 and $81-$82. The top of the range also lines up with a falling trendline from September last year when WTI hit $95.03 and retreated. Immediately ahead, the 200-day moving average lies at $77.20.In the meantime, US crude production in the week to September 27 increased 100,000 b/d week-over-week to 13.3 million b/d. In August, weekly output hit a record 13.4 mb/d twice. Crude imports increased 172,000 b/d to 6.6 mb/d. As did stocks of crude and gasoline, rising 3.9 million barrels and 1.1 million barrels respectively to 416.9 million barrels and 221.2 million barrels. Distillate stocks, however, dropped 1.3 million barrels to 121.6 million barrels. Refinery utilization declined 3.3 percentage points to 87.6 percent.E-mini S&P 500: Currently net long 7.5k, up 43.3k.(Click on image to enlarge)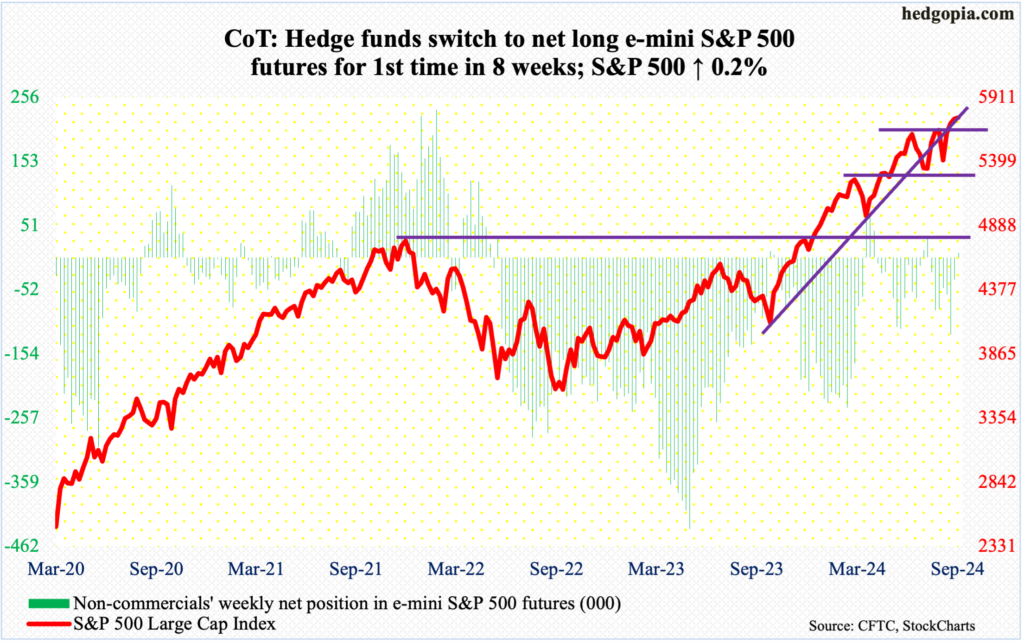
For the second week running, the S&P 500 trudged higher, up 0.2 percent versus last week’s 0.6 percent rise. This follows a breakout at 5670s two weeks ago after the FOMC positively surprised the markets with a 50-basis-point reduction in the fed funds rate. This was on September 19. No sooner did the large cap index break out – 5670 on July 16 and 5671 on September 17 – than a retest occurred on the 20th. Retest continued this week, with bids showing up at or just above the breakout Tuesday through Thursday.After the September 19 breakout, the S&P 500 essentially went sideways with resistance forming at 5760s, with a record high of 5767 posted on the 26th. This is now within reach, with odds of a breakout rising significantly.Ahead of this, non-commercials have switched to net long.Euro: Currently net long 55.3k, down 16.4k.(Click on image to enlarge)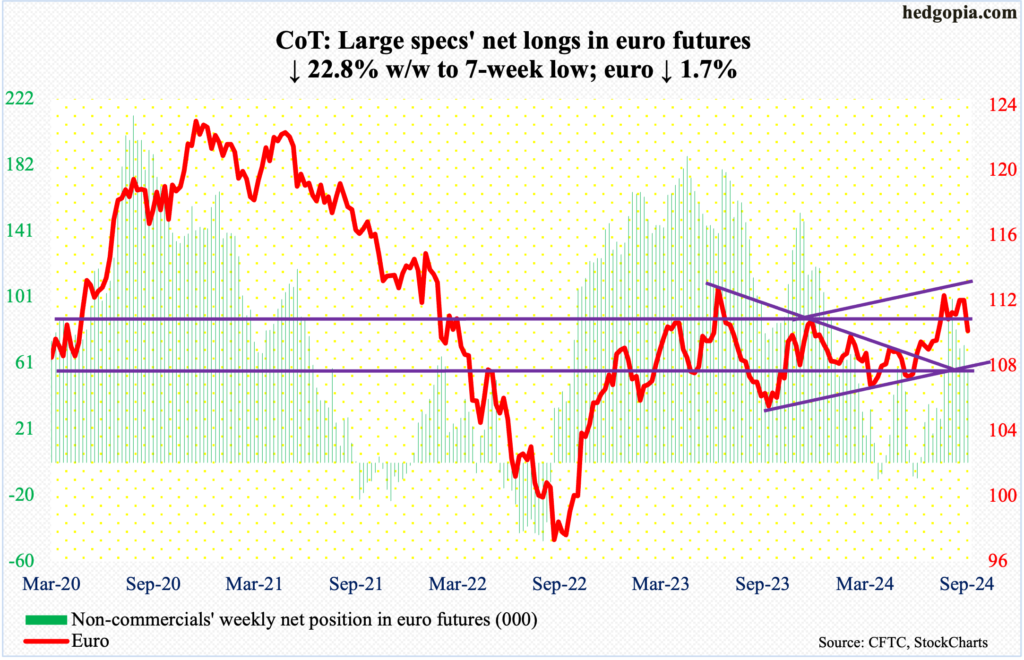
Coming into this week, euro bulls were rejected at $1.12 for six consecutive weeks, having rallied from $1.066 in June. They opened this week with another assault at that hurdle, but to no avail. By the end of the week, the currency gave back 1.7 percent, down in all five sessions to $1.0975, breaching the 50-day at $1.105. The 200-day lies at $1.088. Just underneath at $1.08 rests dual support – horizontal and rising trendline from October last year when the euro bottomed at $1.045.Gold: Currently net long 299.9k, down 15.5k.(Click on image to enlarge)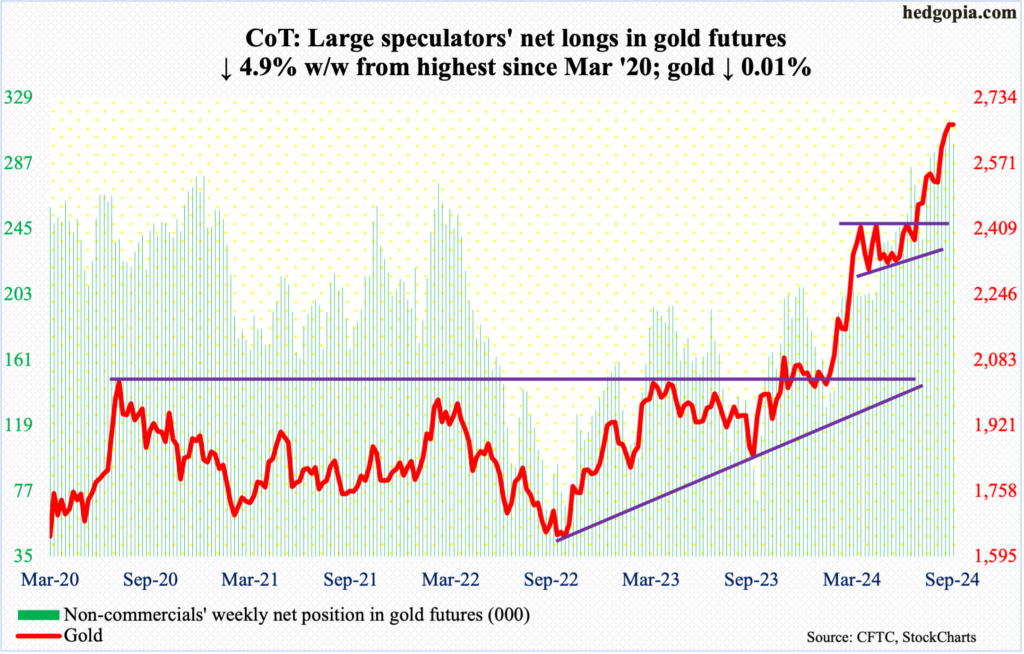
This was a week in which gold bugs had an excellent opportunity to rally, as the tensions between Israel and Iran went up a few notches. Gold ticked $2,695 intraday Tuesday and that was it. By Friday, the metal was essentially unchanged for the week at $2,668/ounce.Gold is ready for a breather. It has had a powerful rally since June when it tagged $2,305. On September 26, it reached a fresh all-time high of $2,709; this was a week in which a weekly shooting star showed up.There is plenty of support underneath. A couple of weeks ago, after five sessions of sideways action at $2,610s, gold broke out on September 20; this followed a breakout in the prior week at $2,540s-50s after several unsuccessful attempts since mid-August. Prior to this, after more than three months of sideways action, the yellow metal broke out at $2,440s-50s in August.Nasdaq (mini): Currently net long 16.1k, up 40.(Click on image to enlarge)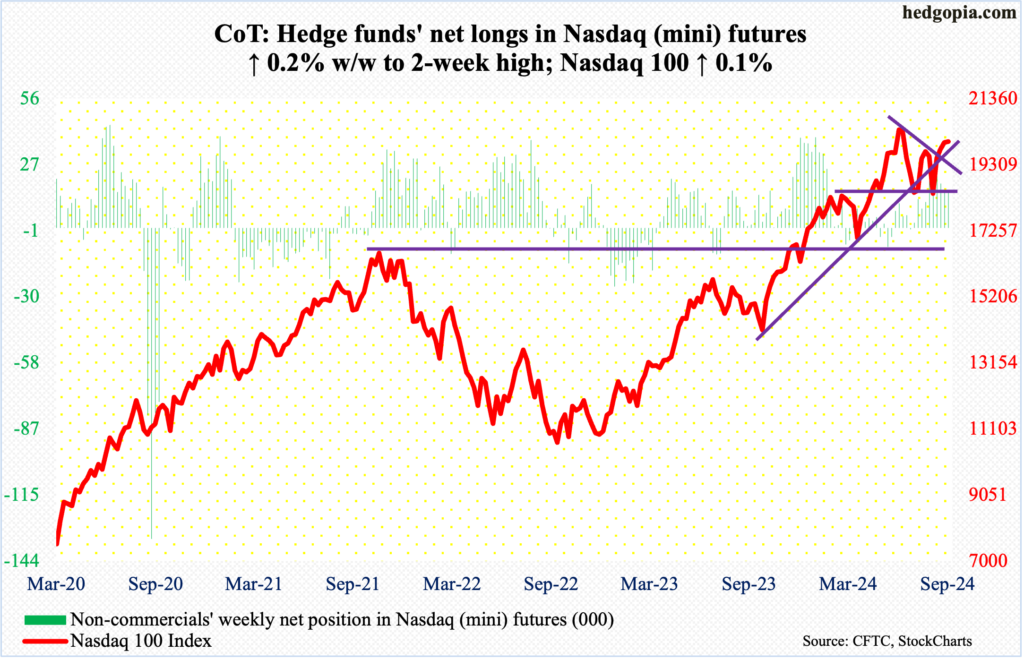
Last week, the Nasdaq 100 came under pressure as soon as it filled a July 17 gap at 20200s. This week, the tech-heavy index dropped to 19622 by Tuesday and was down for the week until Thursday before trader enthusiasm for September’s jobs report sent the index up 1.2 percent on Friday to end the week up 0.1 percent to 20035. It remains under the July 10 record of 20691.The nearest hurdle for tech bulls lies at 20200, which is where a falling trendline from the July high extends to.Russell 2000 mini-index: Currently net long 20.3k, down 1.6k.(Click on image to enlarge)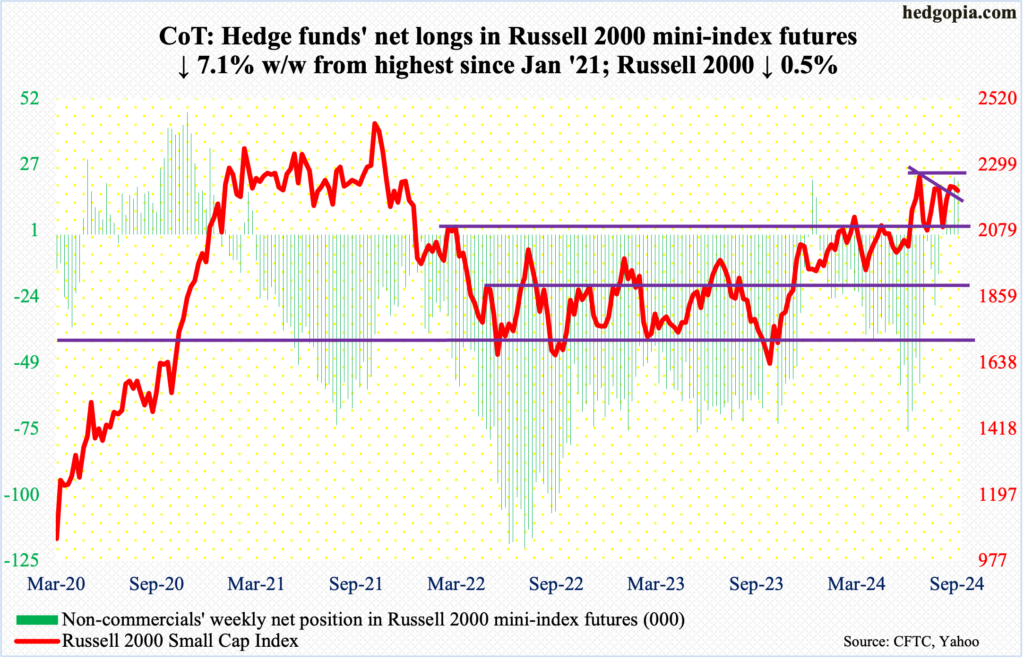
Small-cap bulls celebrated the September jobs report by rallying the Russell 2000 1.5 percent on Friday, but that was not enough to drive the week into positive territory. For the week, the index declined 0.5 percent to 2213.The week began with Monday’s intraday high of 2234, which met with resistance at the top of a descending channel going back to September 18 when the small cap index ticked 2259. Horizontal resistance at 2260s goes back to mid-July, and it is a must-win for the bulls.US Dollar Index: Currently net long 154, down 805.(Click on image to enlarge)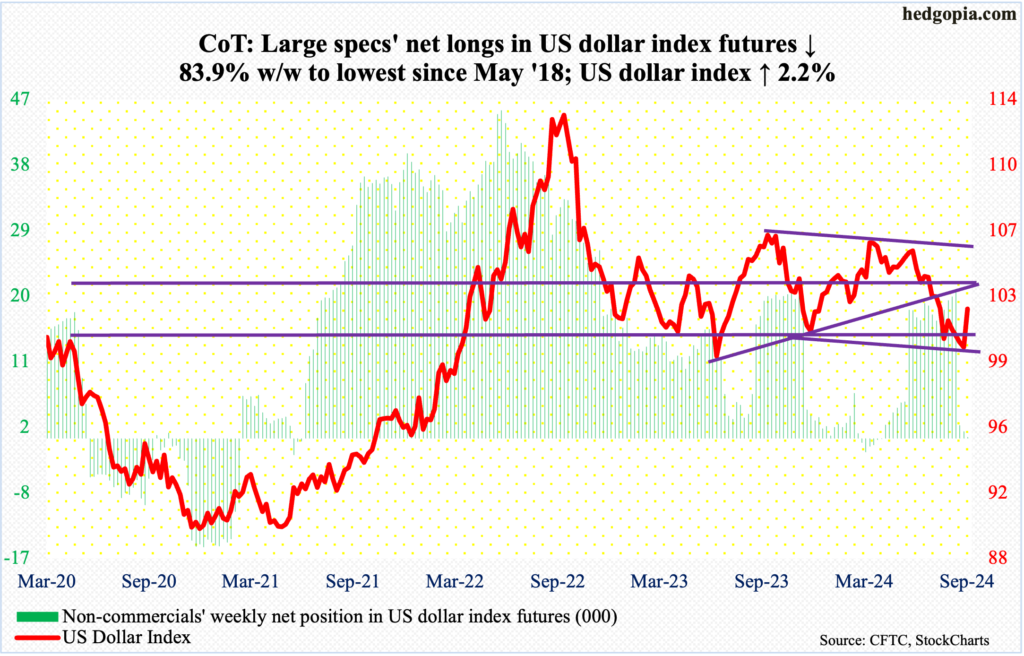
At long last, dollar bulls have decidedly defended crucial horizontal support at 100-101, which goes back years. Having dropped to that support a month and a half ago, with occasional breaches under 100, the US dollar index rallied in all five sessions this week, up 2.2 percent to 102.28.This preceded four weeks of decline in a row – and nine out of 13. The index had been under pressure since ticking 105.80 in June; this was preceded by highs of 106.38 in April and 107.05 last October, establishing a pattern of lower highs. This resistance lies at 105.50s. Before this gets tested, the 200-day is at 103.57.VIX: Currently net short 15.9k, up 10.8k.(Click on image to enlarge)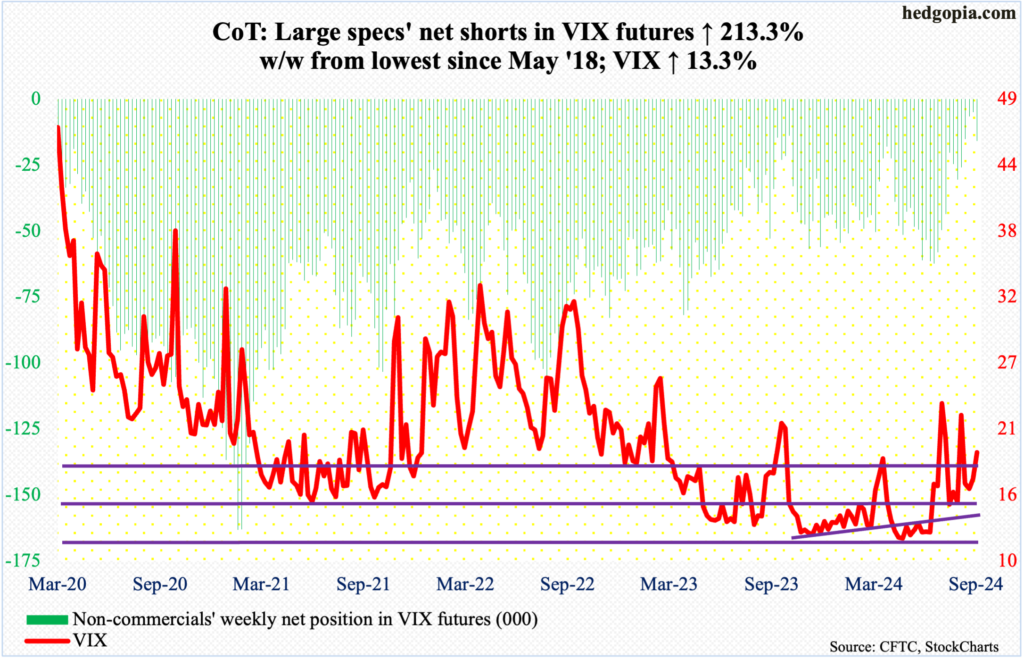
For the second week in a row, VIX and the S&P 500 went hand in hand, with both rallying. This week’s 2.25-point rally to 19.21 follows last week’s bullish weekly hammer in the volatility index. The two otherwise tend to go the opposite ways.There is plenty of room for VIX to continue rallying. There is this though in the near term.Historically, VIX tends to peak as non-commercials either go long or get close to doing that. This week, their holdings were up more than 200 percent from last week’s 5,067 net shorts, which were the lowest since May 2018. If this is as low as this is going to get, the message, if past is prelude, is that VIX heads lower. And it has room to do that, having rallied sharply for a couple of weeks even as the S&P 500 trudged higher.In the meantime, the daily Bollinger bands are tightening. When this happens, VIX tends to have sharp moves – both up or down. One way this could resolve is for VIX to come under pressure in the near term and then rally sharply.More By This Author:
CoT: Peek Into Future Through Futures – How Hedge Funds Are Positioned

