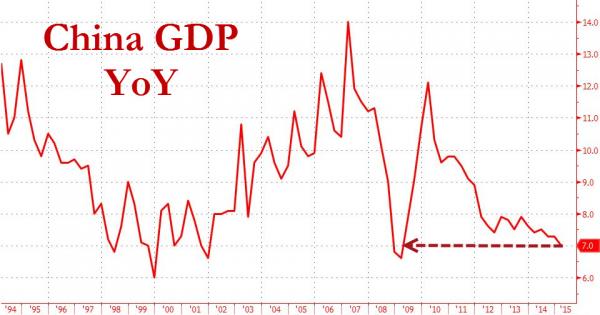
A month ago we warned “Beijing, you have a big problem,” and showed 10 charts to expose the reality hiding behind a stock market rally up over 100% in the last year. Tonight we get confirmation that all is not well – China GDP fell to 7.0% (its lowest in 6 years) with QoQ GDP missing expectations at +1.3% (vs 1.4%). Then retail sales rose 10.2% YoY – the slowest pace in 9 years (missing expectations of 10.9%). Fixed Asset Investment rose 13.5% – the lowest since Dec 2000 (missing expectations). And finally Industrial Production massively disappointed, rising only 5.6% YoY (weakest since Dec 2008). Finally, as a gentle reminder to the PBOC-front-runners, a month ago Beijing said there was no such thing as China QE (and no, the weather is not to blame.. but the smog?).
China YoY GDP “nails the number” magically; but under the surface is a disaster…

Because, as we know, GDP in China is whatever the Beijing politicians say it is (very much like in the US), so we dig deeper.
First, Consumer Sentiment:

Perhaps driven by, or resulting in, a collapse in retail sales: The lowest growth in 9 years

Â
… as well as stagnant and declining auto sales (watch out GM).

Â
But it’s not just the consumer though. The very heart of China’s capital intensive economy – fixed asset investment – is now in V-Fib. The weakest FAI YoY since Dec 2000!!

Â
The chart above explains why demand for global commodities will continue to decline for the foreseeable future. The chart below, on the other hand, confirms Yin Weimin worries about a labor slow down: with Industrial Production slowing, there will be far less end-demand for manufacturing production and labor. At 5.6% YTD YoY growth – this is the worst since Dec 2008!!

Â
And all this leading us to the most important chart of all:Â home prices in China, which are crashing…
