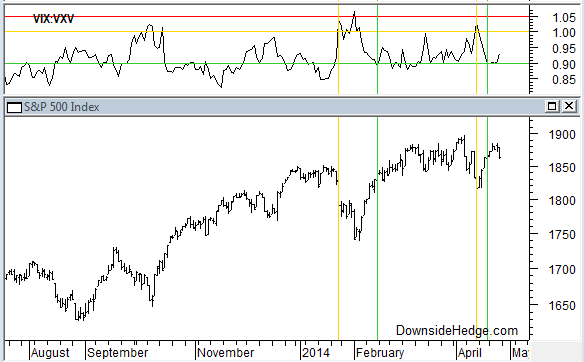
Over the past week we got more of the same from the indicators I follow.  The market chopped around and our indicators had a slight decline.  Market participant appear to be chasing price and being whipsawed by choppiness.  This action is showing up in market internals.  An example  is the ratio between near term volatility (VIX) and mid term volatility (VXV).  On a daily chart it moved above 1.0 signalling caution right at the low of the last dip.  Then when it moved back below .9 (usually signalling “all clearâ€) the market lost momentum and looks to be rolling over again.

The weekly chart of VIX vs. VXV shows two caution signals (above 1.0) since the first of the year that occurred on small dips in price. In addition, both VIX and VXV are making lows above all of the 2013 lows.  This indicates not only increased caution by market participants, but a bit of skittishness.  It is reacting much the same as measures of breadth that I’ve mentioned since the first of the year where small moves in price cause large swings.

Many of our indicators that warn of a rotation to safety and away from risk are starting to urge caution as well. Â These indicators started diverging in late December and are falling like dominoes with a new one warning almost every week. An example is the divergence between high quality bonds and junk bonds.

Our measures of risk continue to show rising caution by investors, but not outright fear.  They are reacting more in line with price than our other indicators, but diverging.  This was a pattern during most of 2013 which resulted in a rising market and no signals from our market risk indicator.  This is why we have a modestly large market hedge instead of an aggressive one (using puts or volatility). Currently,  I suspect our market risk indicator will be the last to signal if the market accelerates downward, but I don’t expect it to lag by much.

