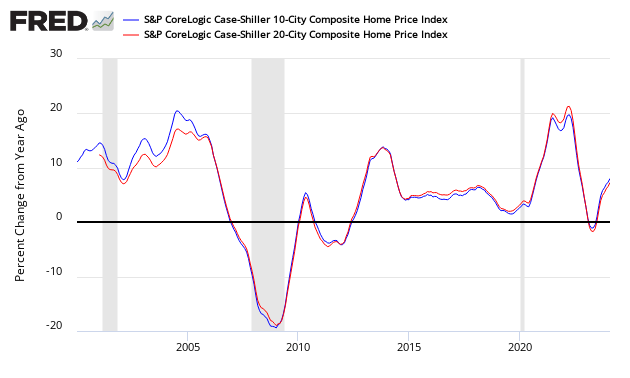
The non-seasonally adjusted Case-Shiller home price index (20 cities) for June 2014 (released today) rate of growth again declined sharply but still shows reasonable year-over-year gain in housing prices.
Â

Â
Â
- 20 city unadjusted home price rate of growth decelerated 1.3% month-over-month. [Econintersect uses the change in year-over-year growth from month-to-month to calculate the change in rate of growth]
- Case-Shiller continues to show the highest year-over-year home price gains of any home price index.
- The market expected:
| Â | Consensus Range | Consensus | Actual |
| 20-city, SA – M/M | -0.5 % to 0.2 % |  0.1 % | -0.2% |
| 20-city, NSA – Yr/Yr | 7.8 % to 9.0 % |  8.4 % | 8.1% |
S&P/Case-Shiller Home Price Indices Year-over-Year Change

Comparing all the home price indices, it needs to be understood each of the indices uses a unique methodology in compiling their index – and no index is perfect. The National Association of Realtors normally shows exaggerated movements which likely is due to inclusion of more higher value homes.
Comparison of Home Price Indices – Case-Shiller 3 Month Average (blue line, left axis), CoreLogic (green line, left axis) and National Association of Realtors 3 Month Average (red line, right axis)
/images/z existing3.PNG
The way to understand the dynamics of home prices is to watch the direction of the rate of change. Here home price growth is now decelerating.
Year-over-Year Price Change Home Price Indices – Case-Shiller 3 Month Average (blue bar), CoreLogic (yellow bar) and National Association of Realtors 3 Month Average (red bar)
/images/z existing5.PNG
There are some differences between the indices on the rate of “recovery†of home prices.Â


