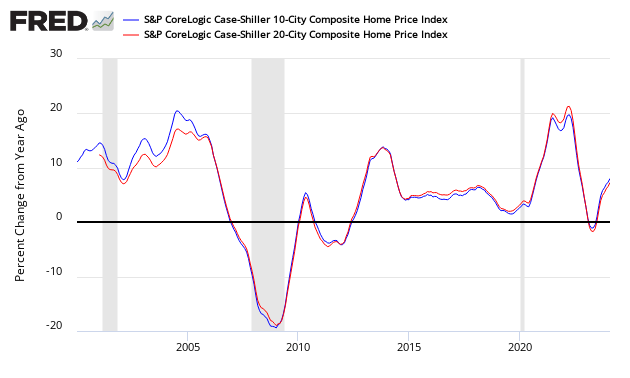
The non-seasonally adjusted Case-Shiller home price index (20 cities) year-over-year rate of home price growth decelerated from 6.7 % to 6.5 %. The index authors stated “Â All these indicators suggest that the combination of rising home prices and rising mortgage rates are beginning to affect the housing market.”

Analyst Opinion of Case-Shiller HPI
Many pundits believe home prices are back in a bubble. Maybe, but the falling inventory of homes for sale keeps home prices relatively high. I continue to see this a situation of supply and demand. It is the affordability of the homes which is becoming an issue for the lower segments of consumers.
- 20 city unadjusted home price rate of growth decelerated 0.1 % month-over-month. [Econintersect uses the change in year-over-year growth from month-to-month to calculate the change in rate of growth]
- Note that Case-Shiller index is an average of the last three months of data.
- The market expected from Nasdaq / Econoday:
| Â | Consensus Range | Consensus | Actual |
| 20-city, SA – M/M | 0.2 % to 0.6 % | 0.4 % | +0.2 % |
| 20-city, NSA – M/M | 0.7 % to 0.9 % | 0.8 % | +0.7 % |
| 20-city, NSA – Yr/Yr | 6.4 % to 6.9 % | 6.6 % | +6.5 % |
S&P/Case-Shiller Home Price Indices Year-over-Year Change

Comparing all the home price indices, it needs to be understood each of the indices uses a unique methodology in compiling their index – and no index is perfect.
The way to understand the dynamics of home prices is to watch the direction of the rate of change. Here home price growth generally appears to stabilize (rate of growth not rising or falling).
There are some differences between the indices on the rate of “recovery” of home prices.
A synopsis of Authors of the Leading Indices:
Case Shiller’s David M. Blitzer, Chairman of the Index Committee at S&P Indices:
Home prices continue to rack up gains two to three times greater than the inflation rat. The yearover-year increases in the S&P CoreLogic Case-Shiller National Index have topped 5% every month since August 2016. Unlike the boom-bust period surrounding the financial crisis, price gains are consistent across the 20 cities tracked in the release; currently, the range of the largest to smallest price change is 10 percentage points compared to a 20 percentage point range since 2001, and a 25 percentage point range between 2006 and 2009. Not only are prices rising consistently, they are doing so across the country.
Continuing price increases appear to be affecting other housing statistics. Sales of existing single family homes – the market covered by the S&P CoreLogic Case-Shiller Indices – peaked last November and have declined for three months in a row. The number of pending home sales is drifting lower as is the number of existing homes for sale. Sales of new homes are also down and housing starts are flattening. Affordability – a measure based on income, mortgage rates and home prices – has gotten consistently worse over the last 18 months. All these indicators suggest that the combination of rising home prices and rising mortgage rates are beginning to affect the housing market.


