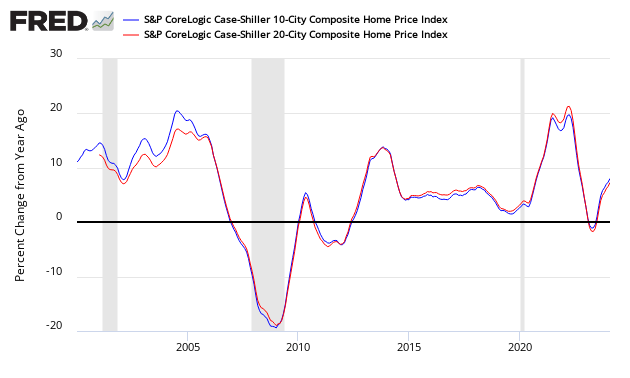
The non-seasonally adjusted Case-Shiller home price index (20 cities) year-over-year rate of home price growth rose from 6.4 % to 6.8 %. The index authors stated, “With expectations for continued economic growth and further employment gains, the current run of rising prices is likely to continue.”

Analyst Opinion of Case-Shiller HPI
Many pundits believe home prices are back in a bubble. Maybe, but the falling inventory of homes for sale keeps home prices relatively high. I continue to see this a situation of supply and demand. It is the affordability of the homes which is becoming an issue for the lower segments of consumers.
- 20 city unadjusted home price rate of growth grew 0.4 % month-over-month. [Econintersect uses the change in year-over-year growth from month-to-month to calculate the change in rate of growth]
- Note that Case-Shiller index is an average of the last three months of data.
- The market expected:
| Â | Consensus Range | Consensus | Actual |
| 20-city, SA – M/M | 0.5 % to 0.7 % | 0.7 % | +0.8 % |
| 20-city, NSA – M/M | 0.1 % to 0.3 % | 0.2 % | +0.7 % |
| 20-city, NSA – Yr/Yr | 6.1 % to 6.6 % | 6.2 % | +6.8 % |
S&P/Case-Shiller Home Price Indices Year-over-Year Change

Comparing all the home price indices, it needs to be understood each of the indices uses a unique methodology in compiling their index – and no index is perfect.
The way to understand the dynamics of home prices is to watch the direction of the rate of change. Here home price growth generally appears to stabilize (rate of growth not rising or falling).
There are some differences between the indices on the rate of “recovery” of home prices.
A synopsis of Authors of the Leading Indices:
Case Shiller’s David M. Blitzer, Chairman of the Index Committee at S&P Indices:
“Home prices continue to rise across the country. The S&P CoreLogic Case-Shiller National Index is up 6.3% in the 12 months through February 2018. Year-over-year prices measured by the National index have increased continuously for the past 70 months, since May 2012. Over that time, the price increases averaged 6% per year. This run, which is still ongoing, compares to the previous long run from January 1992 to February 2007, 182 months, when prices averaged 6.1% annually. With expectations for continued economic growth and further employment gains, the current run of rising prices is likely to continue.
Increasing employment supports rising home prices both nationally and locally. Among the 20 cities covered by the S&P CoreLogic Case-Shiller Indices, Seattle enjoyed both the largest gain in employment and in home prices over the 12 months ended in February 2018. At the other end of the scale, Chicago was ranked 19th in both home price and employment gains; Cleveland ranked 18th in home prices and 20th in employment increases. In San Francisco and Los Angeles, home price gains ranked much higher than would be expected from their employment increases, indicating that California home prices continue to rise faster than might be expected. In contrast, Miami home prices experienced some of the smaller increases despite better than average employment gains.


