Although the market’s uptrend may still technically be intact, there’s no denying it’s in question now.  The very day after the S&P 500 (SPX) (SPY) pushed its way past a key resistance line, it also fell back under it … in spades.  That pullback didn’t crush the uptrend, but we’re close to falling off the edge of the proverbial cliff.  We’ll look at the make-or-break lines in a moment.  The first thing we want to get out of the way is a look at last week’s and this week’s economics-based clues.
Economic Data
It wasn’t too busy last week in terms of economic numbers, but much of what we got was relatively important stuff.
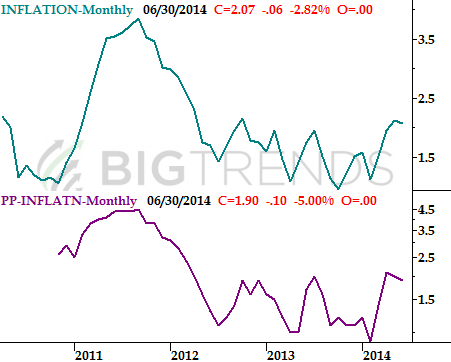
First and foremost, inflation appears to be under control.  Two weeks ago we saw producer price inflation fall for a second straight month, to an annualized rate of 1.9%.  So, we had a decent reason to expected consumer inflation to fall in June too.  And sure enough, it did.  Annualized consumer inflation rate fell from May’s reading of 2.13% to 2.07%.  These are very tolerable levels, and there’s little on the horizon that suggests inflation is bound to grow in the foreseeable future.
Inflation Trends Chart
Source: Â Bureau of Labor Statistics
It was also a big week for real estate number, most of which were encouraging.Â
The good news was, the Federal Housing Finance Agency reported home prices increased by 0.4% between April and May, and existing homes sales reached an annual pace of 5.04 million.  Home prices reached new multi-year highs – again – and are now at early 2008 levels.  The rate of existing home sales is now at the strongest pace since October.
The bad news is, new home sales tumbled from a pace of 442,000 units to 406,000 units in June. Â That’s the weakest reading since September of last year, though it should be noted there’s usually a summertime lull in new home sales activity.

