Remember how awful things were two weeks ago? Â The S&P 500 (SPX) (SPY) plunged 2.6% that week, and it looked like the market was ready to finally dole out that overdue correction. Guess not. Last week, the S&P 500 erased nearly all of the prior week’s loss, and ended the (shortened) trading week on a high note. Â This bodes well for a bullish start to this week.Â
But is last week’s rebound just another fake-out, merely delaying an inevitable corrective move? Â Possibly, though it’s possible the market’s truly back in rally mode. Â Whatever the case [and we’ll handicap the odds of both outcomes below], it may actually be a while before we get a clear answer. Â We’ll show you why in a second. Â Let’s first get the analysis of last week’s economic data out of the way. Â Â
Economic Calendar
All in all, as of last week the economy not only appears to be pointing in the right direction, it appears to be accelerating its growth.
The fireworks got started on Monday of last week with March’s retail sales. Â Retail spending was up 1.1% overall, and up 0.7% when taking automobiles out of the equation. Â Both are not only better than the expected numbers, but outright strong numbers.
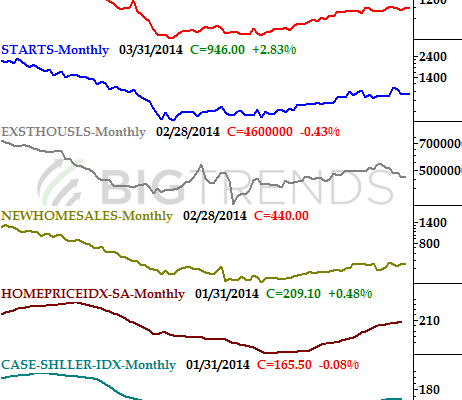
We also got a decent dose of housing and real estate news. Â Although housing starts failed to meet expectations of a pace of 955,000, the annualized rate of 946,000 topped February’s figure of 920,000. Â As for permits, March’s pace of 990,000 was shy of the expected 1.003 million as well as short of February’s 1.014 million, but it’s still a solid figure when we needed to see some clues of a rebound on the housing and construction front.
Real Estate and Housing Trends Chart
Source:Â Â Census Bureau, Standard & Poor’s, and FHFA
We’re going to round out the real estate picture this week with a look at existing homes sales and new home sales.  New homes sales have been in a steady – even if lackluster – uptrend, but as the chart above shows, existing home sales desperately need a shot in the arm.Â

