Watch the video extracted from the before the market open on 5 Dec 2023 below to find out the following:
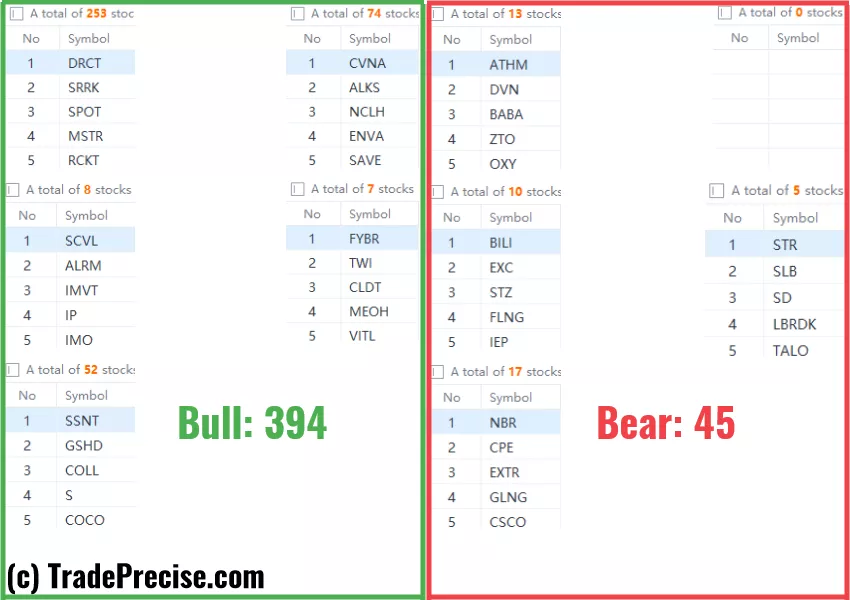
Video Length: 00:06:44The bullish vs. bearish setup is 394 to 45 from the screenshot of my stock screener below pointing to a healthy and positive market environment.

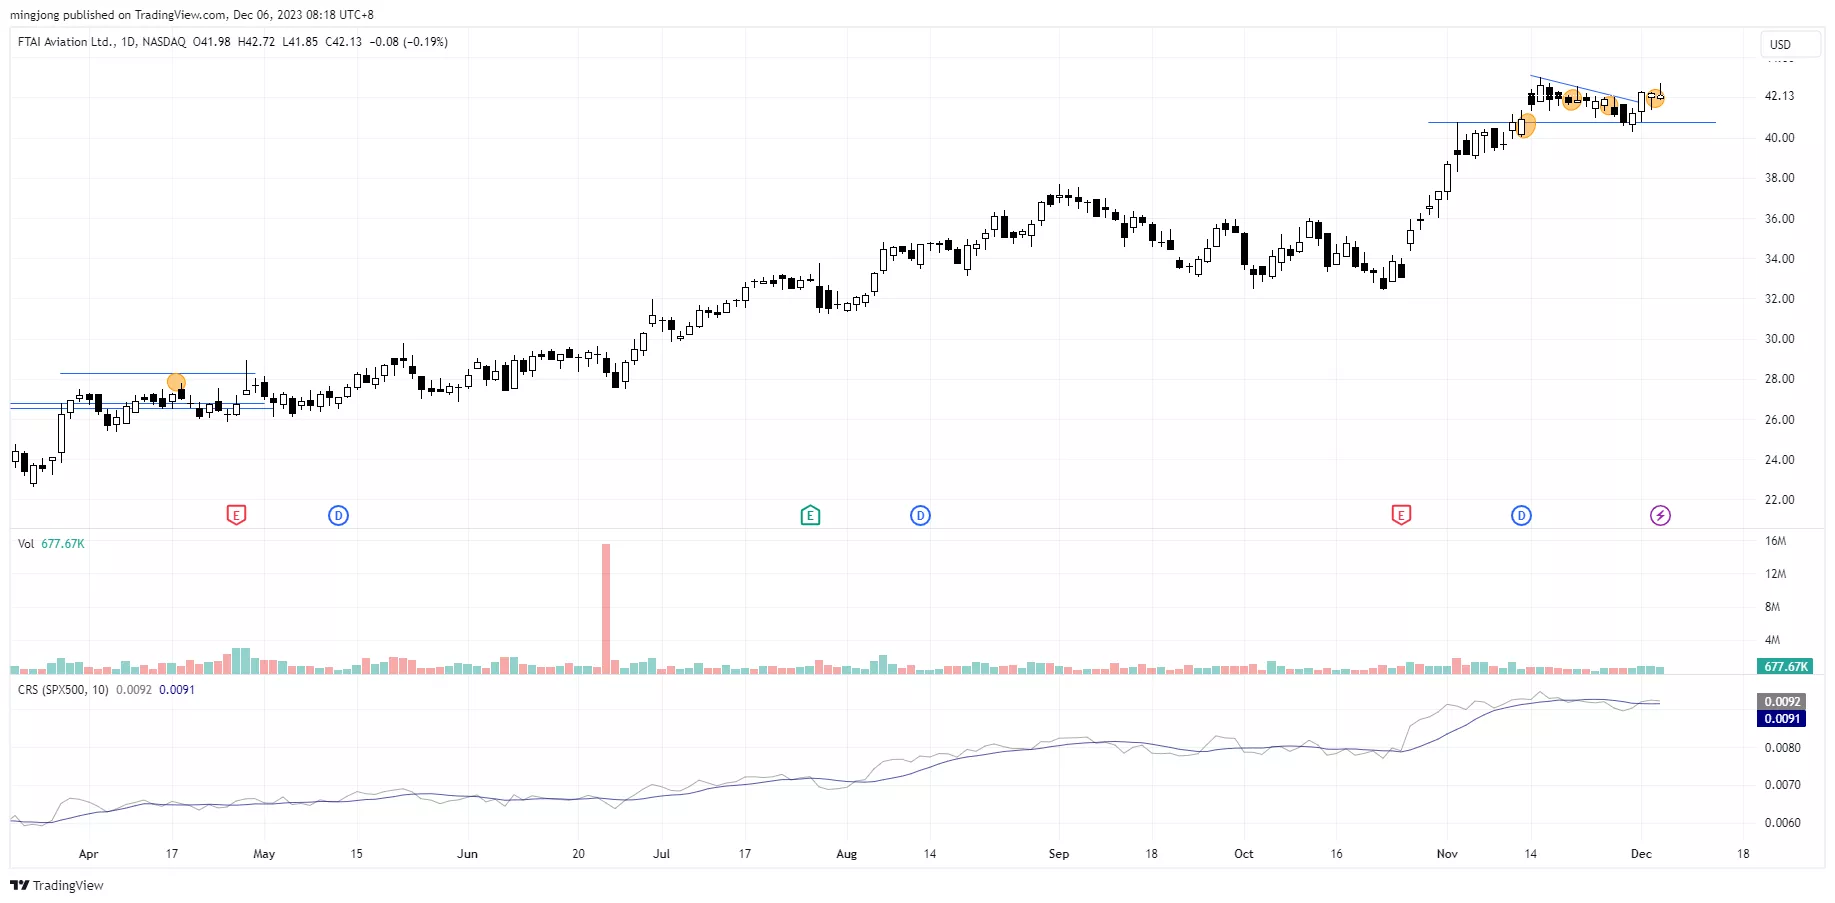
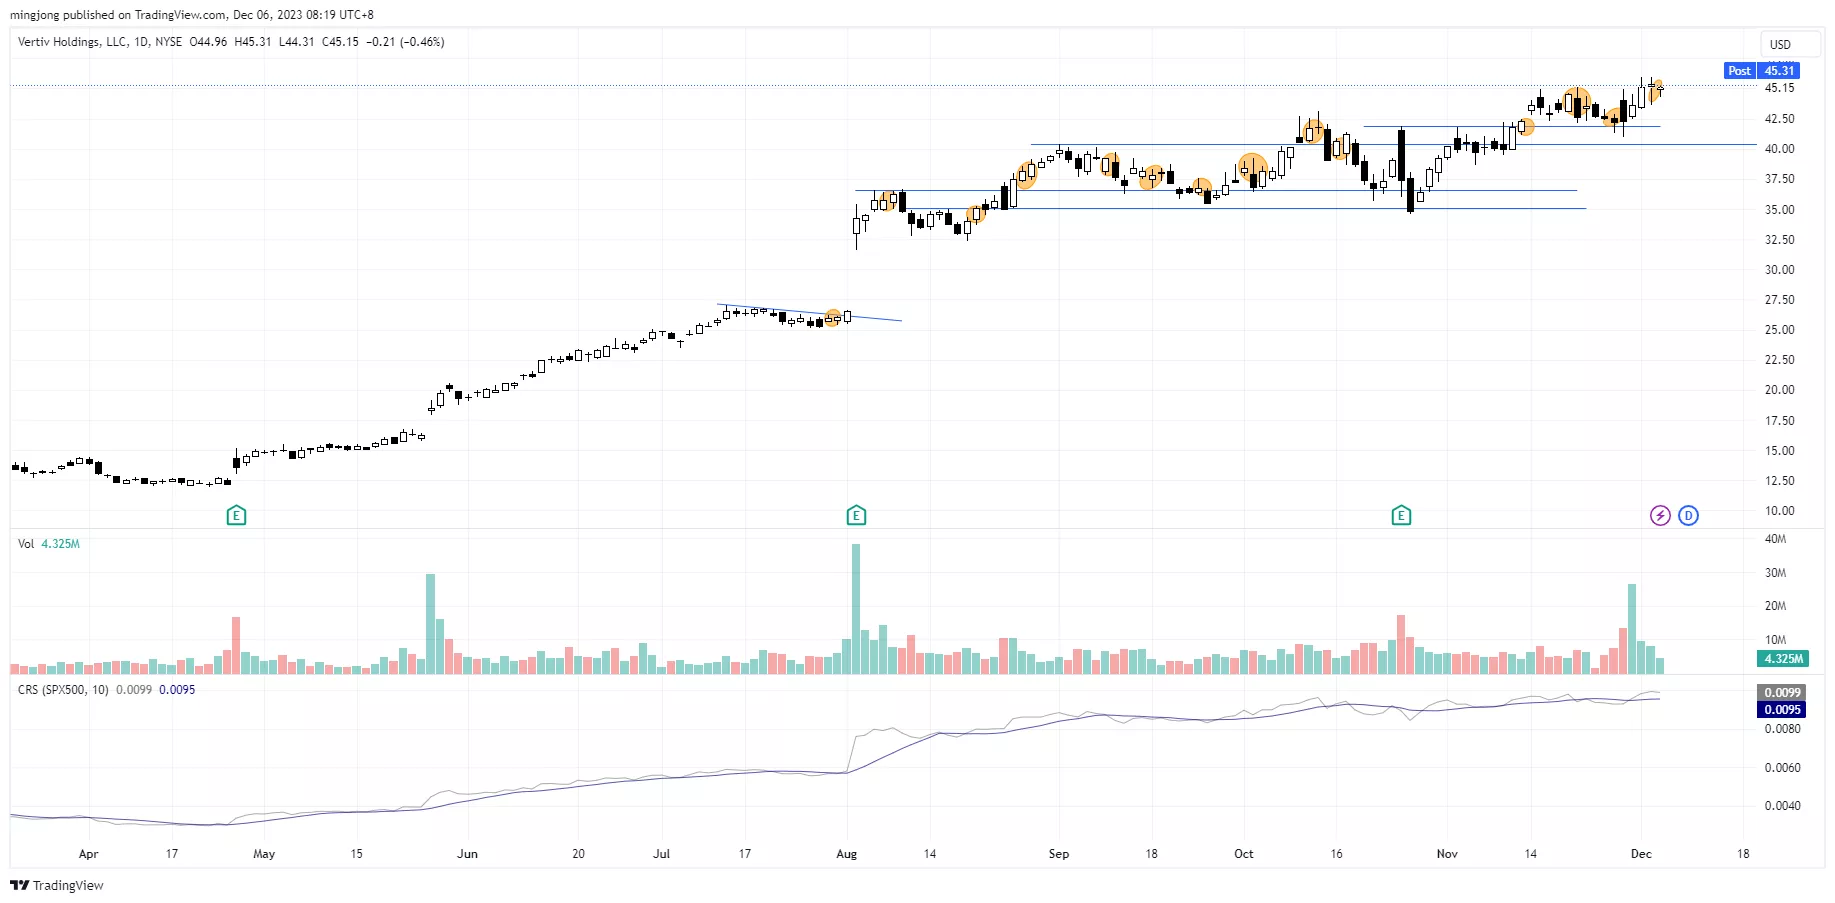
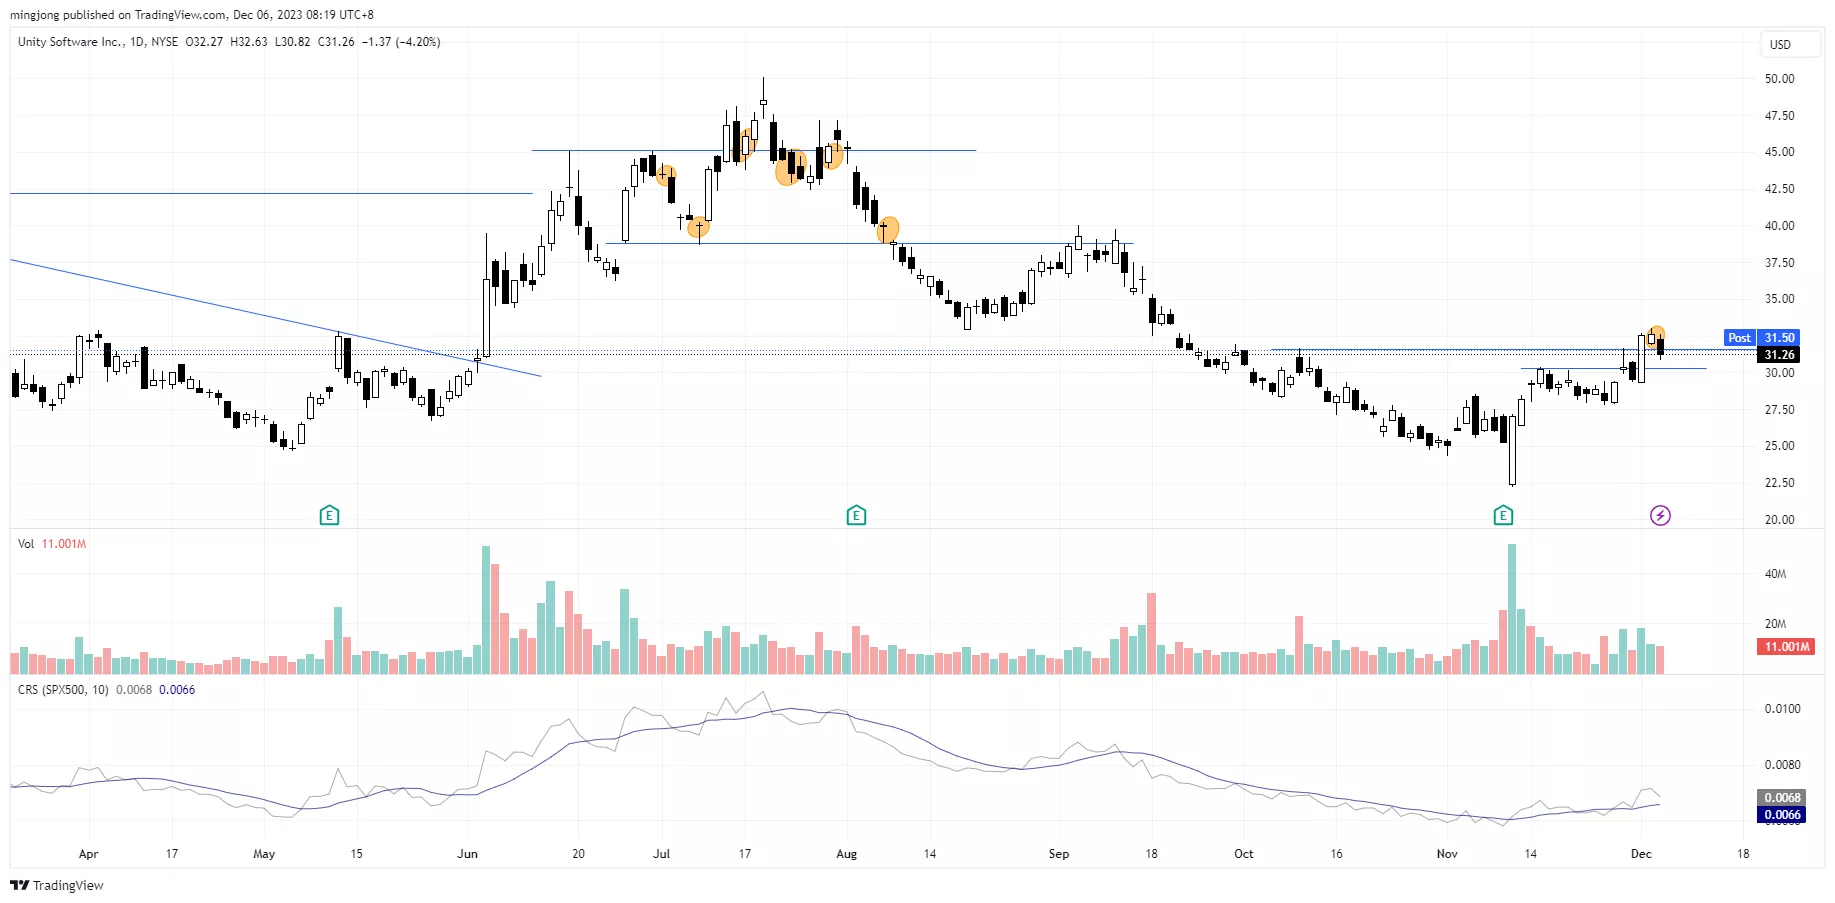
Both the long-term market breadth (200 MA & 150 MA) are above 50%, which are very healthy for a sustainable rally.The short-term market breadth (20 MA) is at the overbought level, which is a sign of strength. Watch out for a pullback/consolidation as some stocks are extended.9 “low-hanging fruits” (, , etc…) trade entries setup + 19 others ( etc…) plus 15 “wait and hold” candidates have been discussed during the live session before the market open (BMO).(Click on image to enlarge)

(Click on image to enlarge)

(Click on image to enlarge)

More By This Author:

