
Bullish View
Bearish View
(Click on image to enlarge)Bitcoin price has remained in a tight range this week as investors waited for the next catalyst. The BTC/USD pair has remained at around 67,500, where it has been in the past few days. It has risen by over 37% from its lowest level in August, meaning that it has moved into a bull market.Bitcoin held steady as it continued facing important catalysts. For example, data shows that the cumulative total net inflows in spot Bitcoin ETFs jumped to $21.23 billion.Most ETFs have accumulated substantial assets since they were approved in January. Blackrock’s ETF rose to over $26.45 billion, while Fidelity’s ETF rose to $12.49 billion, while Ark Invest, Bitwise, and VanEck have over $3.35 billion, $2.8 billion, and $2.2 billion.Bitcoin also remained steady as US bond yields continued rising. The 10-year bond yield rose to 4.2%, while the 30-year and five-year rose to $4.5% and 4%, respectively. These yields rose as doubts that the Fed will continue delivering jumbo rate cuts.The BTC/USD pair has also wavered as the US dollar index has jumped recently. It moved from the year-to-date low of $100 to $104. In most periods, Bitcoin tends to fall when the US dollar is in a downtrend.Its wavering also happened in line with the performance of the stock market. American stock futures have dropped this week as the earnings season continued.
BTC/USD Technical AnalysisThe BTC/USD pair has been in a slow uptrend in the past few days. It rose from a low of 49,060, its lowest point on August 5 to a high of 69,300 on Monday. It has moved slightly above the upper side of the descending channel pattern.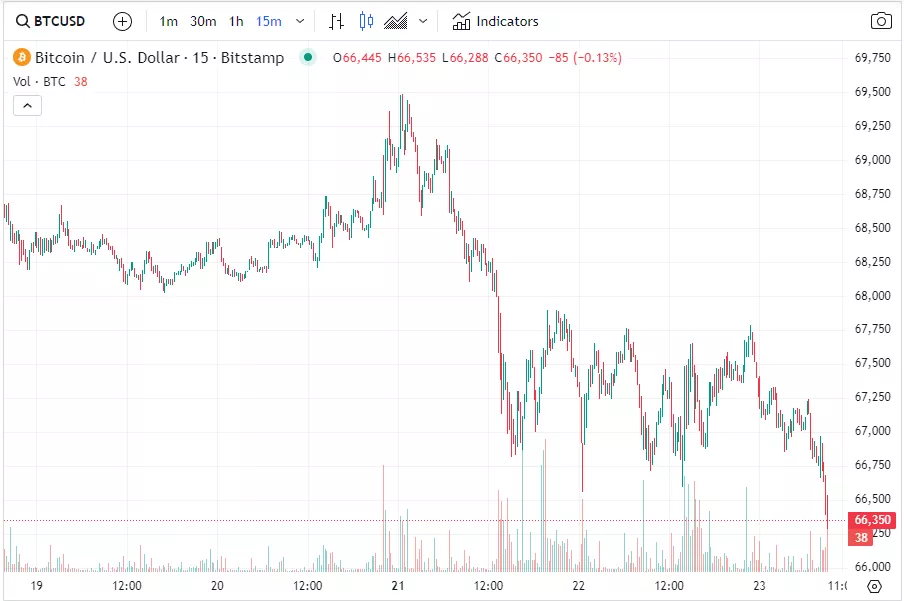 Bitcoin has also risen above the 50-day Weighted Moving Average, meaning that bulls are in control for now. The Relative Strength Index (RSI) has formed an ascending channel. Similarly, the Percentage Price Oscillator (PPO) has continued rising and is above the zero line.Therefore, there are odds that the BTC/USD pair will have a bullish breakout as buyers target the key resistance point at 72,030, its highest point in May and June this year. A break above that level will point to more gains to the all-time high of 73,800.More By This Author:BTC/USD Forex Signal: Bitcoin Could Still Retest Its All-Time HighEUR/USD Forex Signal: Bearish Trend To Continue For A While BTC/USD Forex Signal: Bullish Momentum To Accelerate
