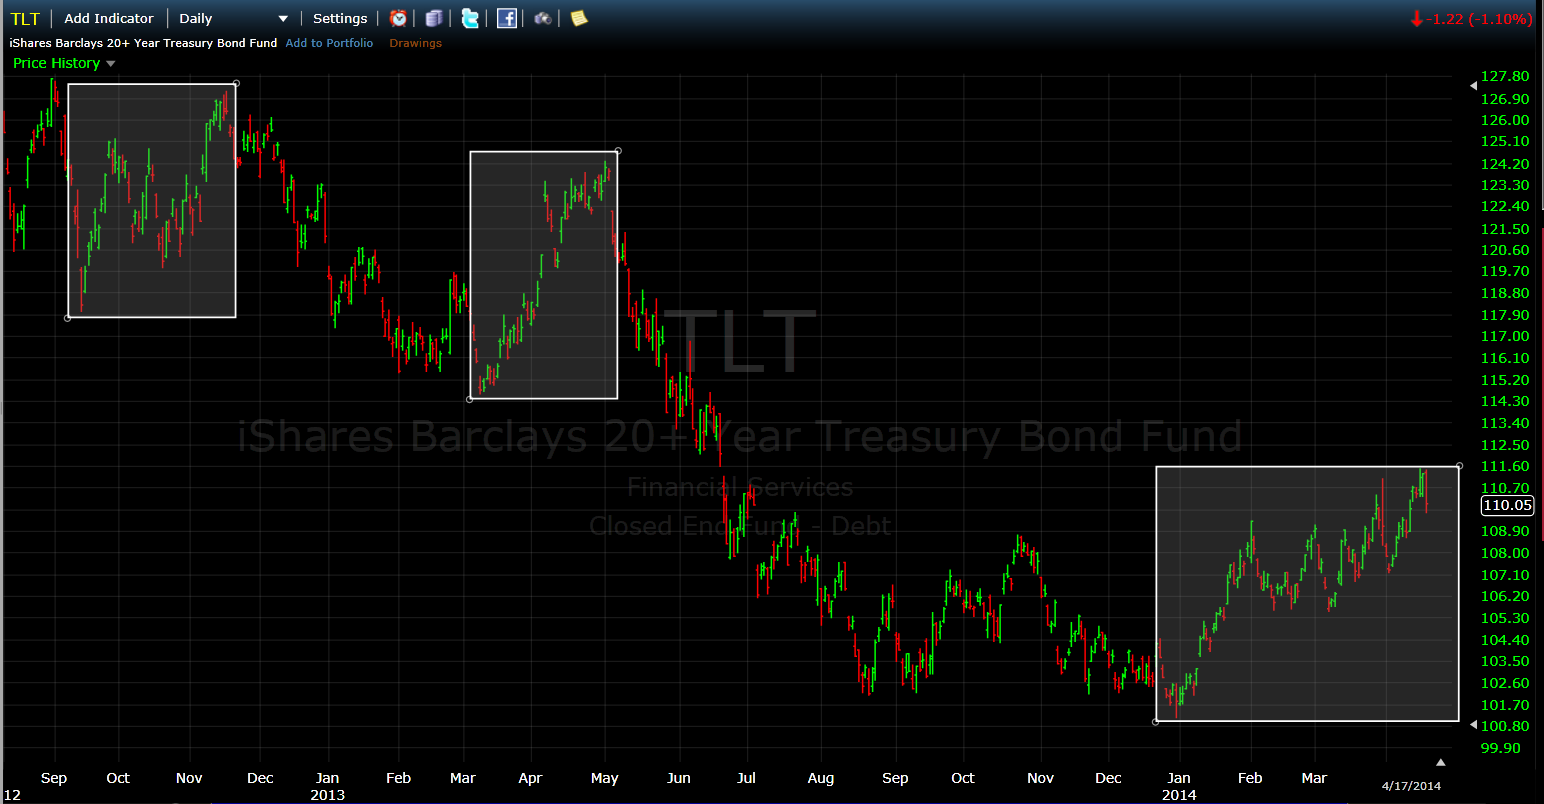

On the Bond side of the equation, I’ll be watching the price action via TLT, an exchange traded fund that tracks the long duration US treasury Bonds. In the daily chart above, going back to the last swing high in the year 2012, I’ve highlighted each retrace rally we’ve seen. The previous two rallies, one in late 2012 and one in mid 2013, took the TLT index up a little more than $9 points each.
Now we fast forward to 2014 and this latest rally in TLT is now about equal to the prior two in length. Now we pointed out the trading range in the 10 year yield in the broad market update, it may all come down to what direction rates breakout. However I believe strength above last week’s high would signal the potential for a much bigger rally, back to $115 would be a logical target and possibly as high as $120.

Earlier this month, Ryan Detrick had a fantastic post quantifying the historical results of the “death cross†on the ten year treasury yield. For those who don’t know, the “death cross†is a technical analysis term used to describe when the faster moving 50 day moving average moves below the slower moving 200 day moving average. The statistics seem to suggest that yields may struggle in the near term, this in turn would be a positive for bond prices and the TLT.
Please check out the entire post here.

I’m also following the spread between high yield corporate bonds and US treasury bonds in the chart above. It’s a good simple gauge of the near term demand for risk. This chart highlights a potential slow down as it has trading below it’s trend line from 2012. This suggests more traders and investors are buying treasuries as opposed to higher yielding and more risky lower grade corporate bonds. Something to watch going forward.
