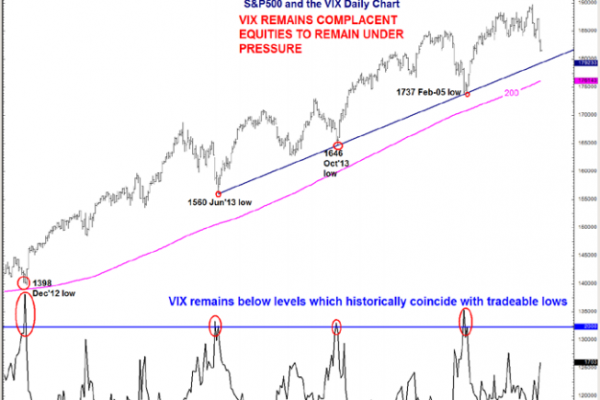
While US equities have spent much of the past several weeks under pressure (the NASDAQ bio tech index has fallen over 21%, the NASDAQ Comp is down over 8% and the S&P500 is down over 4%), BofAML’s Macneil Curry is concerned that the VIX index suggests conditions should deteriorate further before greater signs of a base materialize.
Since 2012 most tradable market lows have come only after the VIX has pushed north of 20%. It is currently only 17%.
In such an environment, US Treasuries should rally further. Indeed, US 10yr yields have broken below key resistance at 2.608%/2.632%, exposing the long term pivot zone of 2.469%/2.399%. The Japanese ¥ should benefit as well. The 200d in $/¥ is key (100.81) A break below would do significant psychological damage and force out many trend followers.
Chart of the week: The VIX is not where it needs to be

While US equities have fallen sharply, the VIX index still shows signs of complacency. Historically, most tradable equity bottoms transpire after the VIX Index trades above 20%.
With it currently residing at 17%, the S&P500 can deteriorate further towards 9m trendline support / 200d avg at 1792/1761
Source: BofAML

