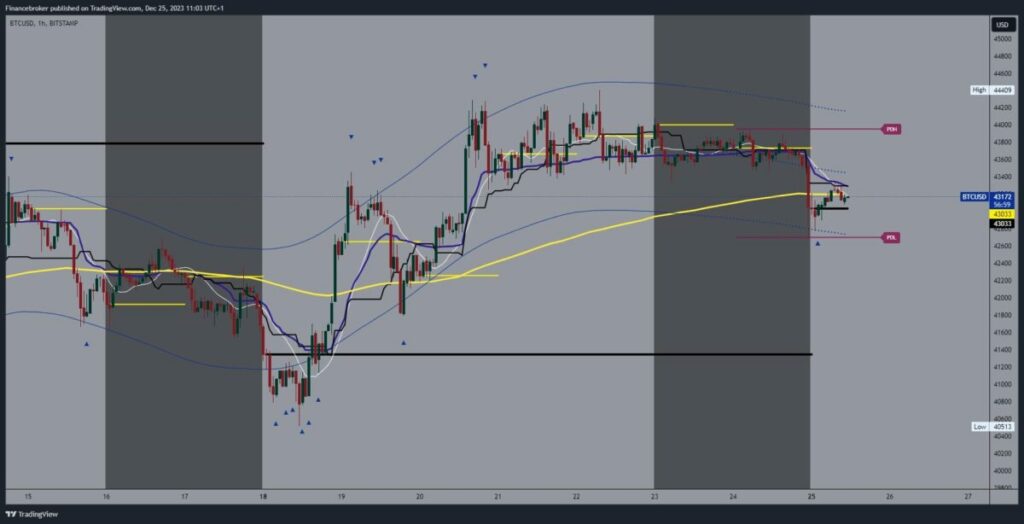
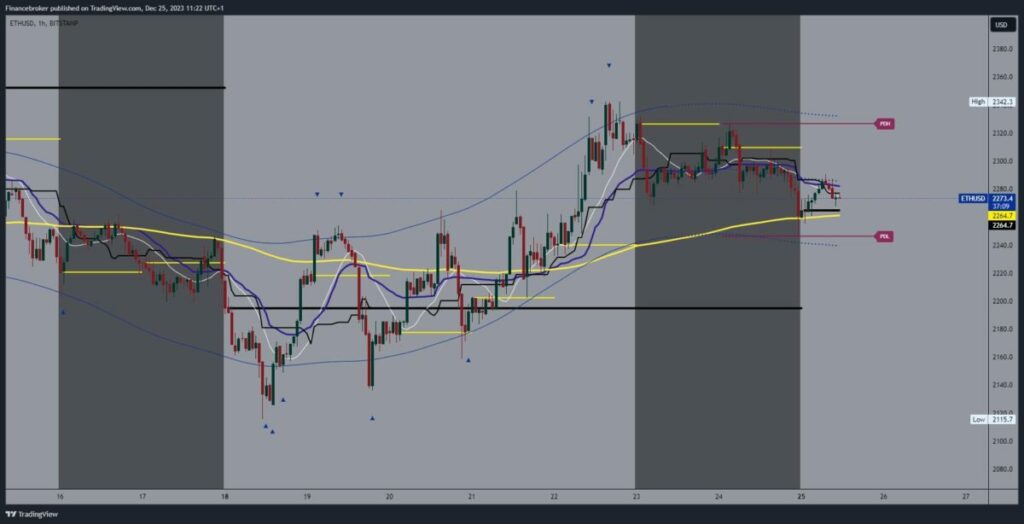
Bitcoin chart analysisIn the previous week, the price of Bitcoin had risen to $44409. From that moment, we started a slight retreat that continues today. Last night, we saw a bearish impulse pushing the price down to $42700. Thus, we saw a drop below the EMA50 moving average. We are currently at the $43150 level and are fighting to move above the EMA50. If we fail to do so, the price could easily slide to a new low.Potential lower targets are $42600 and $42400 levels. We need to get back above the $43400 level for a . Then, we need to stabilize there and form a new bottom at that level. After that, we expect to see further recovery and climb to higher levels. Potential higher targets are the $43600 and $43800 levels.(Click on image to enlarge) Ethereum chart analysisOn Friday, we saw the Ethereum price jump to $2342. There, we encounter resistance and start pulling back below the $2300 level. Yesterday, we tried again to get back above 2300 and only managed to reach the $2320 level. Shortly after that, the price begins a new pullback and falls to the $2240 level. We get new support and return above the EMA50 moving average to the $2275 level.Now, it is important for us to move above $2280 in order to catch the run towards $2300. Potential higher targets are the $2320 and $2340 levels. We would have to drop back below the $2260 level for a bearish option. Thus, we would return below the EMA50 moving average, which could have a negative impact on further movement to the bearish side. Potential lower targets are $2240 and $2220 levels.(Click on image to enlarge)
  More By This Author:The Dollar Index Still Remains Under Pressure This Week Oil And Natural Gas: Oil Is Close To Testing The EMA50 Gold And Silver: Gold Is Holding Above $2050 Level
Bitcoin And Ethereum: Bitcoin Falls To $42700 This Morning

