
 Image Source:
In 2016, I made a life-changing decision: I took a sabbatical, put my family in a small RV, and drove to Costa Rica.Upon my return in 2017, I officially quit my job as a private banker at National Bank and started working full-time on my baby: . I also decided to manage my pension account held at the National Bank. I’ve built this portfolio publicly since 2017 to make a real-life case study. I decided to invest .In August 2017, I received $108,760.02 in a locked retirement account. This means I can’t add capital to the account, and growth is only generated through capital gains and dividends. I don’t report this portfolio’s results to brag about my returns or to tell you to follow my lead. I just want to share how I manage my portfolio monthly with all the good and the bad. I hope you can learn from my experience.This month, I couldn’t help discussing .
Performance in Review
Let’s start with the numbers as of September 5th 2024 (before the bell):Original amount invested in September 2017 (no additional capital added): $108,760.02.
Total return since inception (Sep 2017 – August 2024): 150.27%Annualized return (since September 2017 – 83 months): 14.18%SPDR® S&P 500 ETF Trust () annualized return (since Sept 2017): 13.62% (total return 141.80%)iShares S&P/TSX 60 ETF (XIU.TO) annualized return (since Sept 2017): 9.27% (total return 84.60%)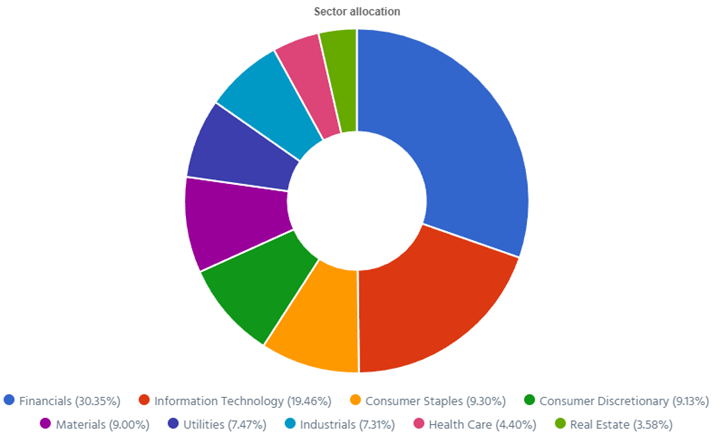 Dynamic sector allocation calculated by as of September 5th 2024.
BCE is Dead to Me
I’m sorry for the strong title. I had to make it crystal clear and get your attention:I’ve never been a fan of BCE, which I always saw as a : a stock that pays a good yield with a good dividend growth policy, but where I don’t expect much stock price appreciation over time. That’s how BCE compares advantageously to a bond: capital stability with better income growth expectations.So, what do we do when the capital isn’t that stable and the dividend growth policy is reduced from 5% to 3%?We do a deep dive into the financials.I’m often asked by members to bring you all with me on this journey into financial statements. In general, I don’t read financial statements from cover to cover. I only do a deep dive when I have questions that don’t have self evident answers. I’m doing this analysis of BCE to find out what will happen with the dividend in 2025.I have summarized my thoughts in the video below, but strongly encourage you to read the complete article.Video Length: 00:14:28So, let’s start the journey with the elephant in the room…
There is a debt problem
Telcos are capital-intensive. It means they must spend considerable amounts of money to maintain and improve their networks. They will go through periods where they borrow more money than they generate because those investments will generate profit in the future.That’s like obtaining a large mortgage in your 20s with the anticipation that you will increase your salary over time. You take the loan now, and you bank on your ability to generate stronger cash flow in the future.Let’s take a look at what the long-term debt looks like in BCE’s 2023 annual statement first: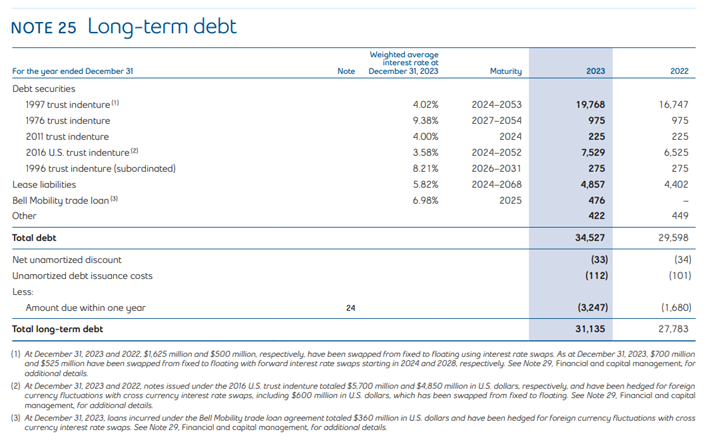 This chart tells us two things.
What the chart doesn’t tell us is what is going on this year so far (we have 2 more quarters to know where this story is going).Let’s take a look at the most recent numbers. I’ll start by looking at the total long-term debt trend for the past 10 years to see where we were, and where we are going.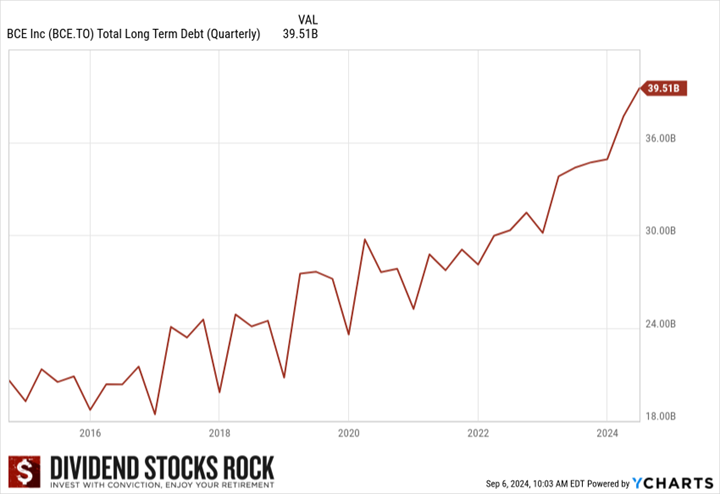 BCE total long-term debt chart generated with Ycharts.
As you can see, we are not going in the right direction. Since 2017, BCE has been on a streak of securing more and more debt. As I’ve discussed this topic before, the point was to obtain inexpensive debt and invest massively in BCE’s network. The good old adage of “you need to spend money to make money”.That’s true… until it isn’t. It all depends on the cost of your debt and the quality of your investments.We will initially focus on the cost of the debt, and we will discuss the results of those investments (cash flow generation) later on.I’ve pulled the latest quarterly update for BCE’s debt. My focus on the next chart is how much of that debt will come to maturity in the next 12 months. It is true that interest rates are a bit lower now than they were 6 months ago. However, Moody’s (a credit rating agency) recently to one notch above the level of junk bonds (to Baa3 from Baa2). This will not help BCE secure better borrowing rates in the coming months.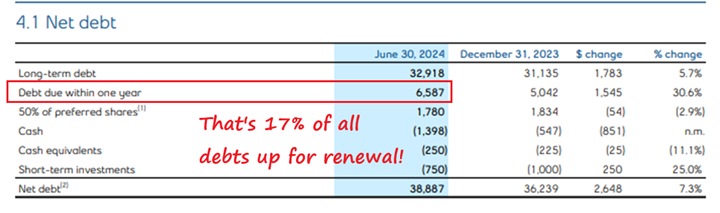
I’d like to draw your attention to the amount of debt up for renewal in the next 12 months (between June 30th 2024 and June 30th 2025). That’s 17% of BCE’s debt that will cost more than it was before. Speaking of interest charges, it’s also out of control.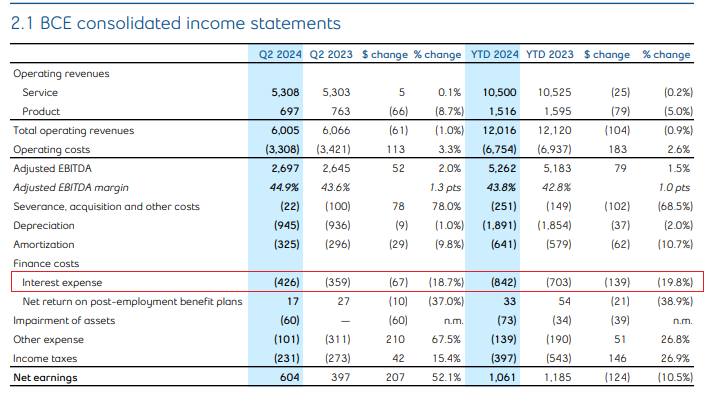
From its latest quarterly earnings report, BCE shows interest expense up by 19% Q2 2024 vs Q2 2023 and up 20% ytd 2024 vs ytd 2023. So, over the past 12 months, the interest expenses increased by roughly 20%. I was curious to know which portion of the debt was up to renewal between June 30th 2023 and June 30th 2024 to have generated this 20% increase.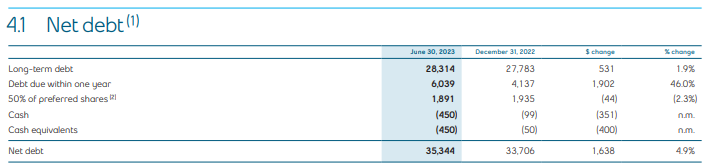
That was $6B, and in the next 12 months (we will see another $6.5B up for renewal). With $6B up for renewal in the past 12 months, how much have interest expenses increased?
Assuming interest expense increases by about 20% again in 2024, we should see a total interest expense of nearly $2B (1.937B) in the next 12 months. This is a little bit more than $300M in free cash flow the company must generate to cover the debt without borrowing more. Speaking of cash flow….
There is also a cash flow problem
So far, we have seen debt going up steadily since 2017. We have now seen how quickly interest expenses are rising and we can expect anything between $200M to $300M more in interest expenses in the next 12 months vs. what BCE paid over the past 12 months.The whole point of borrowing so much money was to invest in BCE’s business and generate more cash flow. Let’s take a look at what has been happening with cash from operations and free cash flow: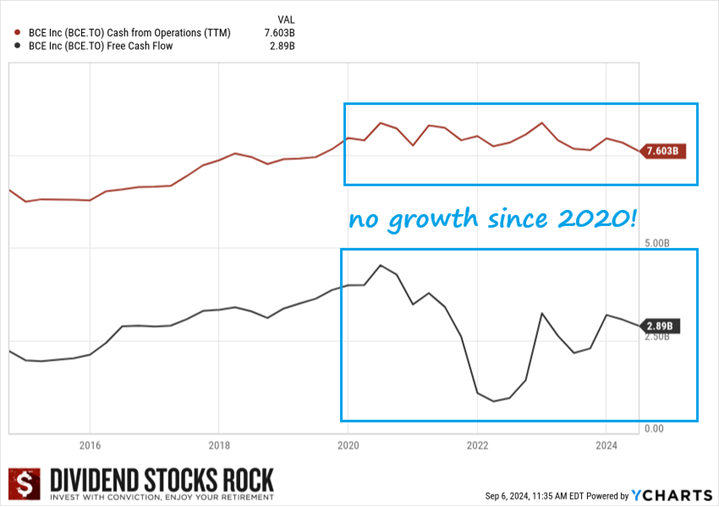 BCE 10yr Cash Flow Chart
Again, since 2020, we have seen no growth in cash flow from operations or free cash flow. That could be explained by a serious lack of growth from BCE over the past five years. The next graph shows that this is an industry problem, as Telus and Rogers also struggled to generate revenue growth over the past five years.The big jump for those two companies is related to acquisitions. The Big Three have invested massively but haven’t been able to generate organic growth to match those investments. With higher interest rates, this becomes a serious problem.We now have a terrible combination of rising debt, rising interest expenses and struggling cash flow growth.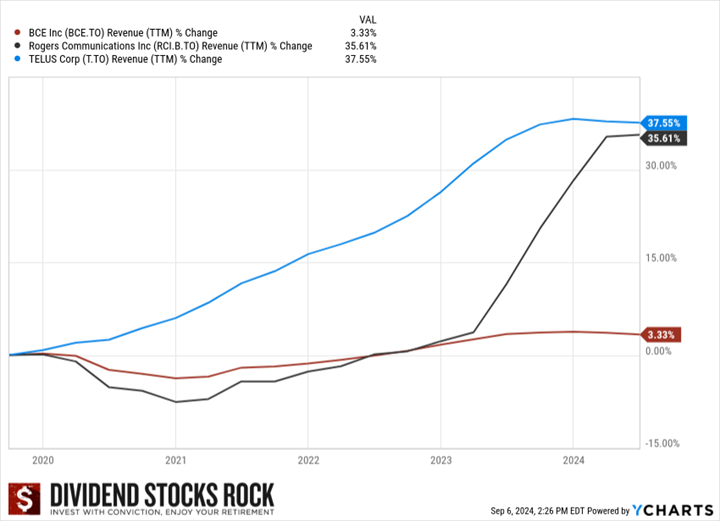 BCE, Telus, and Rogers 5yr Revenue chart.
Which leads to a dividend problem
The main reason why most people want BCE in their portfolio is the dividend. Unfortunately, many investors are blinded by the yield and the company’s reputation and think things won’t change. If BCE has been able to systematically increase its dividend for over a decade, there is no way the company will stop.Wrong.To be clear, I’m not saying BCE will cut its dividend, but I’m saying it’s wrong to think that a company will be there for you forever.Back to the dividend, and is it safe? Let’s take a look at the numbers.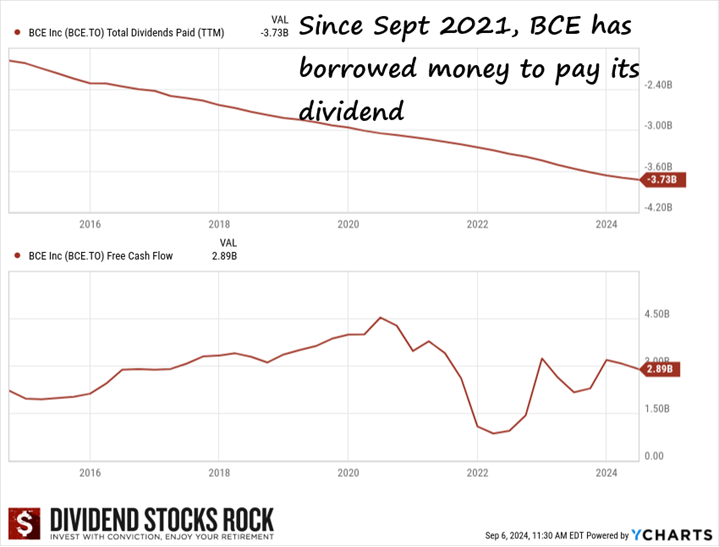 BCE total dividends paid and Free Cash Flow Over 5 years.
These graphs show the dividend payment (top graph)) and the free cash flow (bottom graph). Since 2021, BCE hasn’t generated enough free cash flow to cover its dividend. Therefore, to cover business expenses, capital expenditure and dividends, the company had no choice but to issue more debt.We have seen the debt increase and the results on interest expenses earlier. While this is a valid strategy where a company must sometimes use leverage to grow, it’s important to note it’s not a sustainable strategy over the long haul.After all, you can’t systematically borrow money to pay for traveling and car expenses. Sooner or later, you will have to spend less than you earn and pay down that debt.Let’s take a deeper look at the free cash flow per share vs. the dividend per share.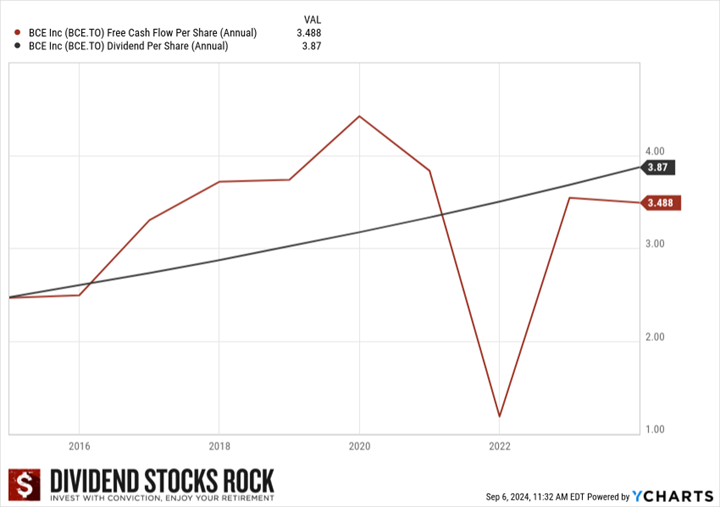 BCE Free Cash Flow vs Dividend Per share 5 ye chart.
This graph clearly shows that dividend payments have exceeded free cash flow since 2021. Considering the amount of new debt and the rising cost of interest, it’s fair to say that BCE will likely borrow more money in 2025 to cover its expenses if nothing changes.
The solution, if you ask me…
BCE can’t continue borrowing money and distributing dividends like candies on Halloween. If I was CEO, I would seriously think of chopping this useless payment in my income statement called dividends to pay off debts and provides BCE with additional “financial flexibility”. I don’t think BCE is there yet, and we have more chances to see a pause in the dividend growth in 2025. That would be the minimum the business could do to get out of this rut and get back on track. BCE has created a situation where if it hits another road bump (such as a recession), it won’t be able to maintain its promises.
Smith Manoeuvre Update
The portfolio is slowly taking shape with 11 companies spread across 7 sectors. My goal is to build a portfolio generating 4-5% in yield across 15 positions. I will continue to add new stock monthly until I reach that goal. My current yield is 4.68%.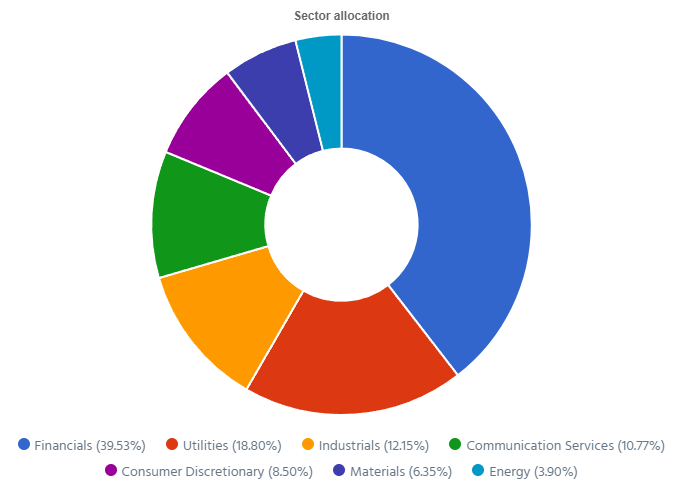 Smith Manoeuvre Portfolio Sector Allocation.
Paying down the margin by $500
Two months ago, I made a “larger play” into CWB.TO by purchasing about $1,500 worth of shares. I used my regular $500 per month plus $1,000 from the margin account to make that purchase. This month, I’m not doing a new buy and simply reimbursing a portion of the margin account to bring it down to $0.I’m using the margin account when I see a good opportunity and I want to bolster my positions quickly. Once again, keep in mind that it’s not a significant amount compared to all my assets and that’s why I’m “playing” with this money.Here’s my SM portfolio as of September 5th, 2024 (before the bell):
Let’s look at my CDN portfolio. Numbers are as of September 5th, 2024 (before the bell):
Canadian Portfolio (CAD)
My account shows a variation of +$1,084.74 (+1%) since August’s income report.
Alimentation Couche-Tard disappoints againATD reported a mixed quarter as revenue jumped by 17%, but EPS declined by 4%. The decrease in EPS was largely driven by softer traffic and fuel demand along with reduced fuel margins in the U.S. markets. However, the company maintained healthy margins on its merchandise which partially mitigated the impact of lower fuel profitability. Same-store sales were also down across all segments (-1.1% in US, -2.1% in Europe and 3.9% in Canada). ATD hasn’t spoken about its offer to acquire Seven & i, but we know 7Eleven wants a higher price for its assets. We know ATD to be disciplined so they may increase their offer, but ATD will surely not overpay.I discussed the situation on The Moose on the Loose podcast episode below.
CCL Industries thrives on strong organic growthCCL Industries reported a record quarter with revenue up 12% and EPS up 26%. This growth was driven by 8.5% organic sales growth, a 3% contribution from acquisitions, and 0.7% from currency translation. Sales per segment were CCL +14.5%, 4.6% from acquisitions, and mid-single digit organic sales growth in Europe and North America and double-digit growth in Asia Pacific and Latin America. Avery was up 3.3% (mix of organic and acquisition), while Checkpoint was up 16.1% on 17.5% organic growth. Innovia was up 8.3% with 6.2% of that being organic growth. CCL expects the operating performance of its segments, particularly in RFID and Direct-to-Consumer badging at Avery, to continue driving growth.
Granite REIT is “business as usual”Granite REIT reported another good quarter with revenue up 8% and AFFO per share up 7%. The payout ratio for the quarter was 70% (vs 73% last year) and 69% for the first 6 months (vs 71%). NOI was $116.8 million in the second quarter of 2024 compared to $108.6 million in the prior year period. That was an increase of $8.2 million primarily as a result of the completion of a development property in Brantford, Canada in the first quarter of 2024, contractual rent adjustments and consumer price index-based increases and renewal leasing activity.
National Bank is a rockstarIt feels like National Bank is playing in another league these days. The bank reported EPS up 24%, driven by strong performance across all segments. P&C was up 15%, driven by growth in loan and deposit volumes while PCLs were up only $4M vs. last year. Wealth management was up 19% driven by growth in fee-based revenues and net interest income. Financial markets were up 55%, driven by growth in global markets revenue and in corporate and investment banking revenues. U.S. Specialty & Intl. was also up 23% driven by a strong performance of both Credigy and ABA Bank. NA also expects to close the acquisition of CWB by the end of 2025.
Royal Bank is robustRoyal Bank reported a robust quarter with revenue up 13% and EPS up 15%. Personal & commercial banking was up 17%, driven by HSBC assets acquisition. Excluding HSBC Canada results, net income was up 7%. Wealth management was up 30% driven by higher fee-based client assets reflecting market appreciation and net sales. Insurance was down 21% largely due to lower insurance investment. Capital markets were up 23%, primarily due to higher municipal banking activity, higher loan syndication activity in the U.S., higher debt origination in North America and favorable USD conversion factors.You can watch my complete Canadian Banks most recent Quarterly Review .
Stella Jones sells more utility poles and railway tiesStella-Jones reported another solid quarter with revenue up 8% and EPS up 13%. This growth was driven by a strong performance in its infrastructure-related businesses, particularly in the utility poles and railway tie segments which saw organic sales growth of 10%. The utility pole segment benefited from increasing demand for pole replacement programs in both the U.S. and Canada, while railway ties growth was driven by higher pricing and steady demand from Class 1 railroads. Sales in the residential lumber segment saw a slight decline due to lower demand and a softening in lumber prices.Here’s my US portfolio now. Numbers are as of September 5th, 2024 (before the bell):
U.S. Portfolio (USD)
My account shows a variation of +$3,969.13 (+3.4%) since August’s income report.
Brookfield Corp break $1T in assets under management!Brookfield continues to perform well this year with higher distributable earnings per share (+11% before selling assets, +80% after selling assets this quarter). The company raised $68 billion in the second quarter bringing total assets under management to approximately $1 trillion. Cash and liquid assets increased to $62 billion while deployable capital reached $150 billion. Brookfield completed $800 million of share buybacks in 2024.The company is focusing on growing its insurance and credit capabilities, which are expected to be a strong driver of future earnings growth.Home Depot faces headwindsHome Depot did better than expected despite mediocre growth (revenue +0.6%, and EPS +0.4%). Revenue includes approximately $1.3B in contributions from its recent acquisition of SRS Distribution. However, comparable sales fell by 3.3%, reflecting ongoing challenges in consumer demand due to higher interest rates and macroeconomic uncertainty. Despite declining comparable sales, Home Depot met its earnings expectations, benefiting from disciplined cost management and efficiency improvements. Management expects more headwinds for the rest of the year, with comparable sales down 3 to 4% in 2024 and EPS down 2% to 4%.
My Entire Portfolio Updated for Q2 2024
Each quarter we run an exclusive report for Dividend Stocks Rock (DSR) members who subscribe to our very special additional service called . The PRO report includes a summary of each company’s earnings report for the period. We have been doing this for an entire year now and I wanted to share my own DSR PRO report for this portfolio. You can download the full PDF showing all the information about all my holdings. Results have been updated as of June 30th, 2024.
Dividend Income: $456.07 CAD (+9.8% vs August 2023)
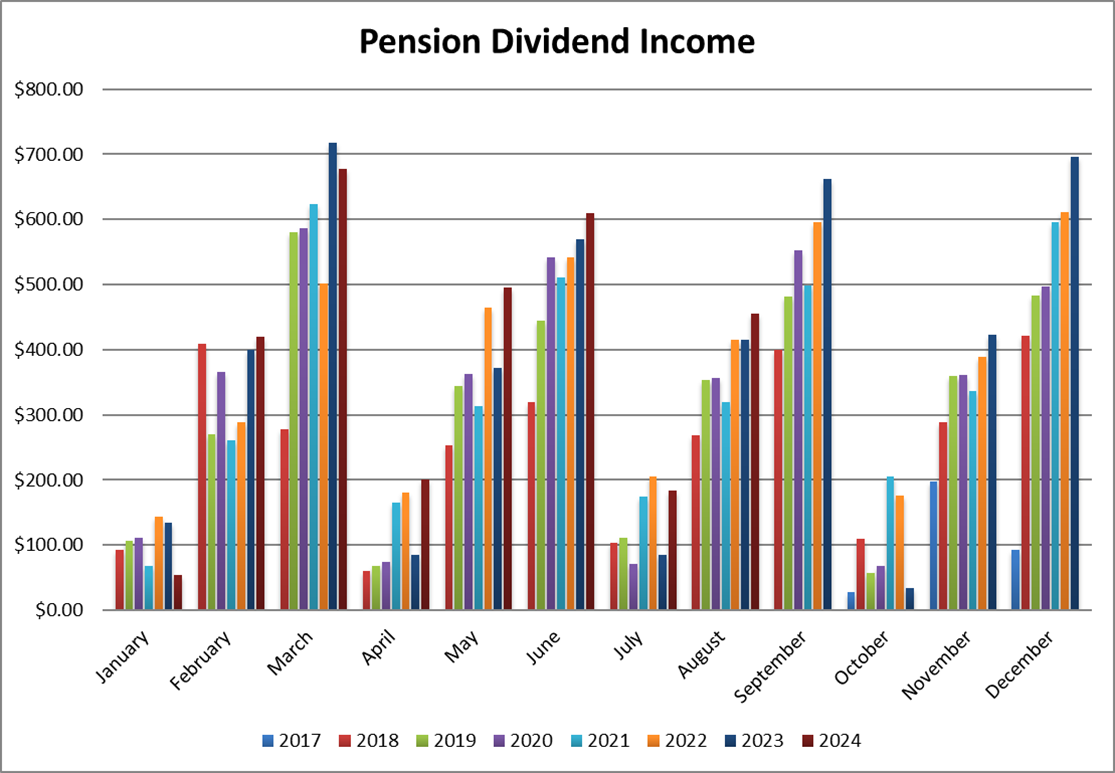 Pension Dividend Income Month over Month since Inception.
All companies in my portfolio have increased their dividends over the past 12 months, resulting in an almost double-digit increase this month.So far this year, I’m on pace to show 8% dividend growth across my portfolio.
Dividend growth (over the past 12 months):
Canadian Holding payouts: $260.60 CAD.
U.S. Holding payouts: $144.58 USD.
Total payouts: $456.07 CAD.*I used a USD/CAD conversion rate of 1.352Since I started this portfolio in September 2017, I have received a total of $27,210.71 CAD in dividends. Keep in mind that this is a “pure dividend growth portfolio” as no capital can be added to this account other than retained and/or reinvested dividends. Therefore, all dividend growth is coming from the stocks and not from any additional capital being added to the account.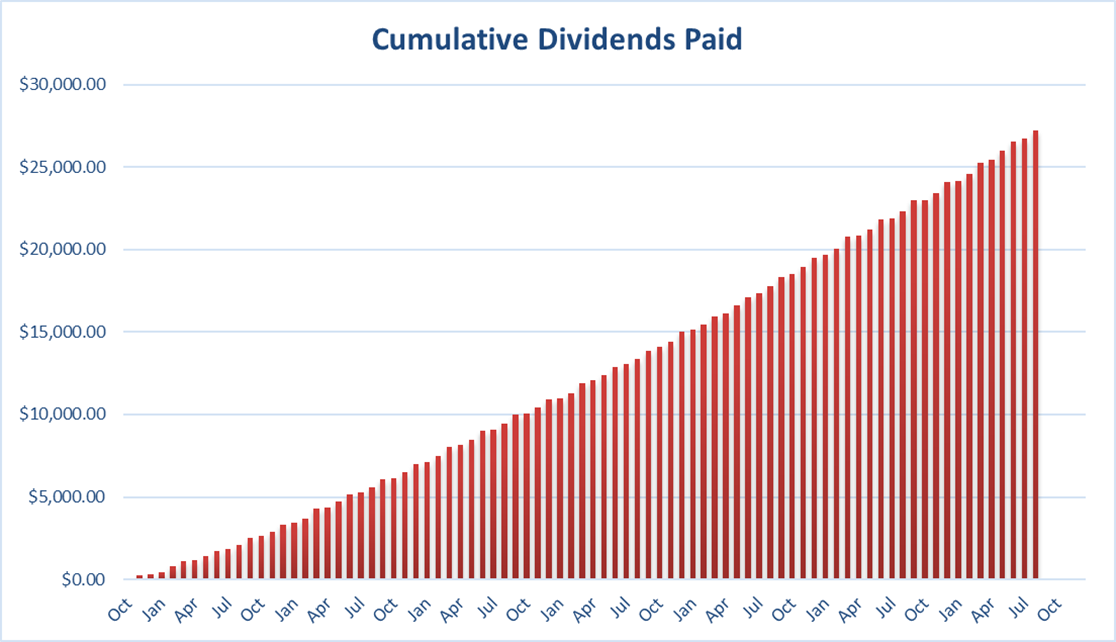 Cumulative dividends paid since inception.
Final Thoughts
You probably noticed I moved above $1,000 in cash across my US and Canadian accounts. This liquidity will soon be used to increase my position in Toromont Industries (TIH.TO) since it’s my smallest holding. I don’t expect to do any other trades by the end of the year unless one of my top holdings breaks the 10% barrier of all my portfolios (hello, Apple!).More By This Author:
