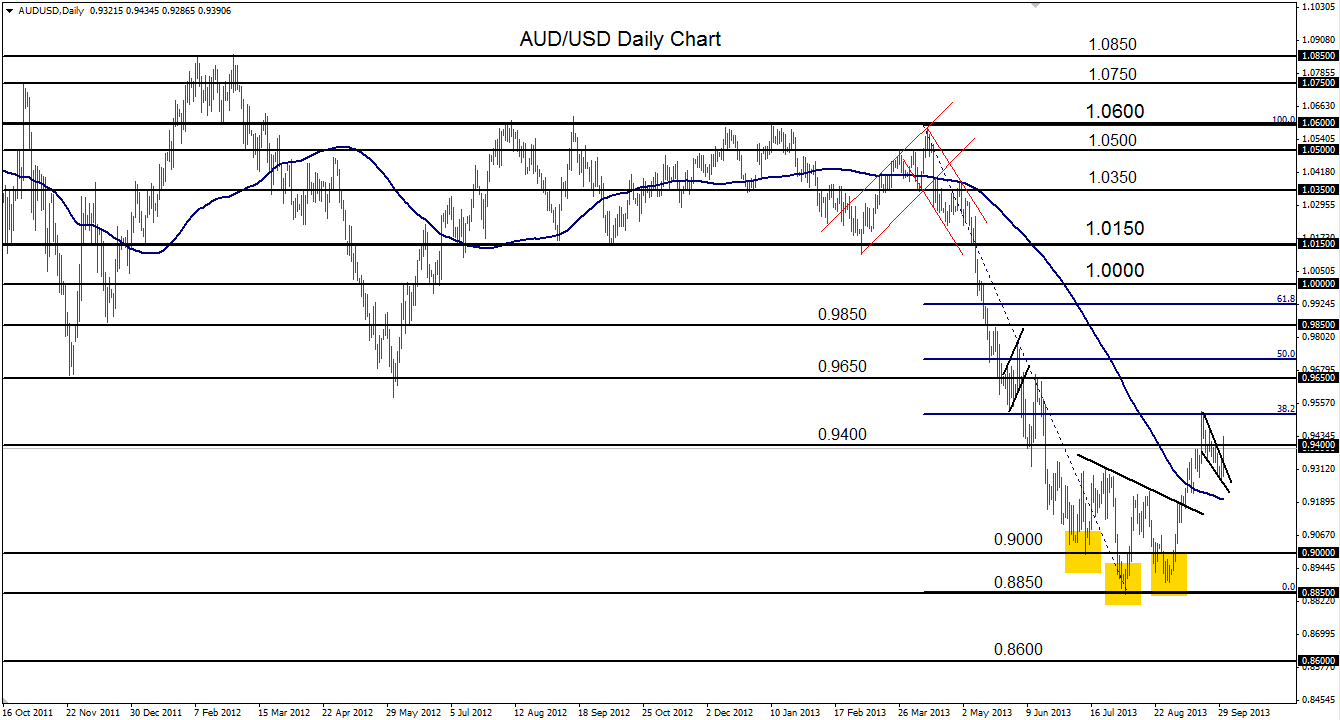

October 1, 2013 – AUD/USD (daily chart) has advanced to breakout tentatively above the upper border of a pennant consolidation pattern. This pattern, most often considered a potential trend continuation pattern that represents a temporary pullback within a trend, occurs after the pair hit a high of 0.9527 two weeks ago, which was right at the 38.2% Fibonacci retracement level of the long and steep plunge from the April 1.0600-area high down to the August 0.8850 low. In turn, that 38.2% Fib retracement was preceded by an inverted head-and-shoulders reversal pattern (left shoulder around 0.9000, head around 0.8850, right shoulder around 0.8890) that occurred in July and August. The breakout above the head-and-shoulders neckline that occurred in early September provided further indication of a potential reversal of the AUD/USD downtrend. After reaching the 38.2% retracement, pulling back in the noted pennant pattern, and now breaking out tentatively above the upper border of that pattern, the pair could be poised once again to continue the upside reversal by targeting key resistance objectives at 0.9650 and 0.9850.
James Chen, CMT
Chief Technical Strategist
City Index Group
Forex trading involves a substantial risk of loss and is not suitable for all investors. This information is being provided only for general market commentary and does not constitute investment trading advice. These materials are not intended as an offer or solicitation with respect to the purchase or sale of any financial instrument and should not be used as the basis for any investment decision.


