
 Image Source:
The Applied Materials () stock price has come under intense pressure this year as investors continued to question its growth. It has dropped by over 28% from its highest level this year, meaning that it has moved into a bear market.
Applied Materials is a top tech enablerApplied Materials is one of the top companies in the semiconductor industry, where it provides systems used to fabricate chips. Its products are used by some of the biggest companies in the semiconductor industry like Taiwan Semiconductor, Samsung, Intel, and Micron. For example, Applied Materials is a leading player in , Rapid Thermal Processing (RTP), Physical Vapor Deposition (PVD), Chemical Vapor Deposition (CVD), and Electrochemical Deposition (ECD).AMAT also has the Applied Global Services business, which runs fab consulting, subfab equipment, automation software, and supply chain assurance programs. Additionally, Applied Materials is a top player in the display industry, where it makes products used in the television, smartphone, laptops, and other consumer products. Over time, AMAT has become one of the biggest players in key industries that are growing rapidly. For example, while NVIDIA is known for its artificial intelligence business, Applied Materials is involved behind the scenes. Applied Materials revenue has done well in the past few years as demand for its solutions has continued growing. Its annual revenue moved from $14.6 billion in 2018 to over $26.5 billion in the last financial year. This growth has mostly been organic since the company has not made any major acquisitions in the past few years.It has instead focused on improving its offerings and gaining market share. For example, it has gained market share in the DRAM market by ten points in the last decade. It also expect to grow in the DRAM industry by 10% to $6.5 billion in the next few years, helped by its 4F2. Also, the management believes that transition to 3D DRAM will boost its addressable opportunity by double digits.
AMAT’s business has stalledThe most recent financial results showed that its business has stalled. Its revenue in the last quarter grew by 8% to $6.78 billion, helped by its semiconductor systems business whose revenue rose to $4.9 billion. Its foundry and logic revenue accounted for 72% of its semiconductor systems segment. Applied Global Services revenue rose slightly to $1.58 billion, while its smaller display business rose to $251 million. These numbers mean that Applied Materials business is growing at a slower pace compared with other popular semiconductor companies like Nvidia and Super Micro Computer.
Applied Materials earningsThe next important catalyst for the Applied Materials stock price will be its earnings, which are scheduled for November 11. Analysts expect its revenues will come in at $6.95 billion, a 3.5% increase from the same period last quarter. This will be followed by an increase to $7.2 billion in the next quarter. For the annual financial year, analysts expect its results to show that its revenue to be $27.12 billion, a 2.3% from last year. This revenue will be followed by $30 billion in the next financial year. Applied Materials has a forward dividend yield of about 0.87%, which is fairly smaller than other companies. As such, by investing in it, your total investment return will likely be smaller than other firms.On the positive side, analysts believe that its stock should be trading at $231, about 26% from its current level.
Applied Materials stock analysis(Click on image to enlarge)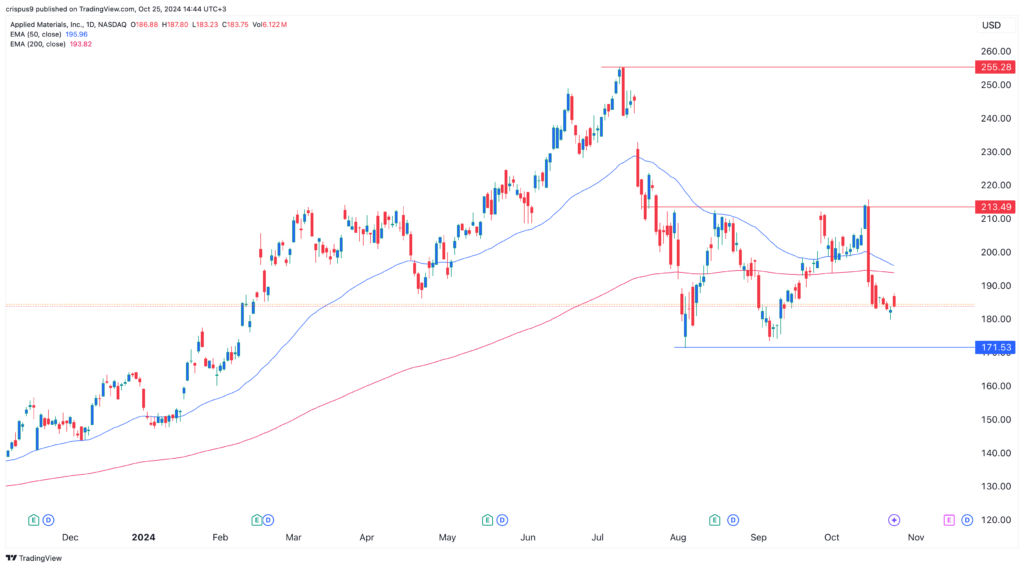 AMAT chart by The daily chart shows that the AMAT share price has been in a strong bearish trend in the past few days. It formed a triple-top pattern at $213.50. In most periods, this is one of the most bearish patterns in the market.The stock is also about to form a death cross pattern as the 200-day and 50-day Exponential Moving Averages (EMA) near their crossover. In most periods, a death cross is one of the most bearish patterns in the market. This cross has already formed when using the weighted moving average (WMA).Therefore, the stock will likely have a bearish breakout as sellers target the next important support level at $171.53, its lowest point in August.More By This Author:
