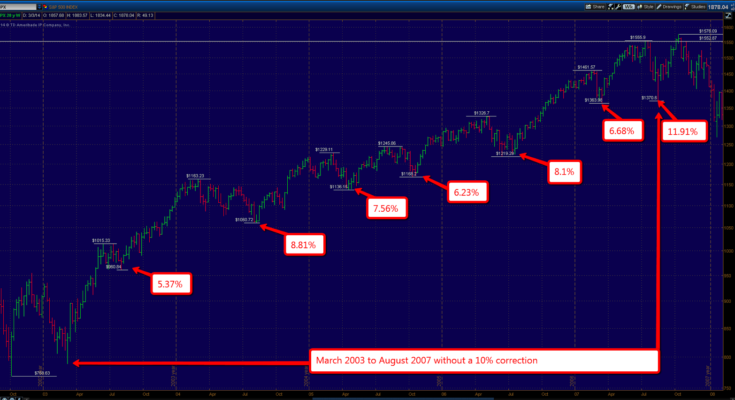
The last major long term rally in stocks occurred around October of 2002 and topped out in October 2007, measuring 5 years in total. If you are in the camp that the current bull market began in 2009, then we have a current bull market that is also reaching it’s 5th anniversary.
I’ve decided to take a closer look at that previous bull market, specifically the corrections that occurred within. The chart above encapsulates the entire five year bull market run and it shows a relative lack of volatility within.Â
Actually I must confess I was a little surprised to see that within, there was over a 4 year span where the S+P 500 did NOT suffer even a 10% correction. I’ve noted the correction sizes in the chart above.Â
In next week’s post I will break down the current bull market off the 2009 lows. But I think this is interesting to note because our current rally has seemed to go on for so long without a “meaningful” correction that everyone is waiting for. But according to this chart, recent history has shown longer periods of time where the stock market did not pull back in a meaningful way for awhile.

