The Advent/Claymore Global Convertible Securities and Income Fund (NYSE:AGC) is a closed-end fund that was formed in May 2007. AGC seeks total return from current income and capital appreciation. The fund invests at least 80% of the portfolio in convertible securities or non-convertible income securities from US and non-US issuers:
- At least 50% in convertible securities
- Up to 40% in non-convertible income securities
- At least 50% in foreign securities
The fund uses leverage and may invest in securities of any credit quality including securities below investment grade (e.g. junk bonds or high yield). AGC also uses a covered call option strategy on up to 25% of the portfolio, which allows it to pay out larger distributions.
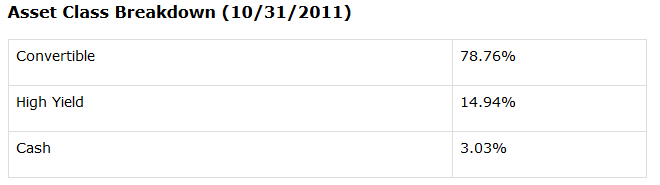
This is the asset class breakdown as of Oct. 31, 2011:

AGC has a spotty NAV performance record. It has performed well in bull market periods and poorly in bear market periods. It was walloped in 2008, losing over 56% of its value.
I see it more as an attractive short-term swing trade here, rather than a long-term buy and hold investment. Here is the total return NAV performance record since inception:

Fund Management
Advent has managed convertible securities since inception in 1995. It has managed high-yield securities opportunistically in its convertible strategies and have managed a dedicated high-yield convertible strategy.
Here are some summary statistics on AGC:
Advent/Claymore Global Convertible Securities Income Fund
- Total Assets: 401.1 Million Total Common assets: 316.1 Million
- Annual Distribution (Market) Rate= 13.04%
- Last Regular Monthly Distribution= $0.0664 (Annual= $0.7968)
- Fund Expense ratio: 1.93% Discount to NAV= -12.96%
- Portfolio Turnover rate: 125%
- Credit Rating: 80% below investment grade or unrated.
- Effective Leverage: 21.21% (1.43% interest rate)
- Average Daily Volume (shares)= 103,000
- Average Dollar Volume = $0.85 Million
AGC is currently selling at a discount to NAV of -12.96% compared with the 6-month average discount of -5.27%. The 1-Year Z-Statistic is -2.49. This means the current discount to net asset value is about 2.5 standard deviations below the one year mean.
