Â

The advance estimate of first quarter 2014 Real Gross Domestic Product (GDP) is a positive 0.1%.
- The market expected GDP at +0.5% to 2.0% (consensus 1.1%).
- This data point was 2.6% in 4Q2014.
This advance estimate released today is based on source data that are incomplete or subject to further revision. (See caveats below.)Â Please note that historically advance estimates have turned out to be little more than wild guesses.
Real GDP is inflation adjusted and annualized – the economy is both expanding in cumulative and on a per capita basis.
Real GDP per Capita

The table below compares the 4Q2013 third estimate of GDP (Table 1.1.2) with the advance estimate 1Q2014 GDP which shows:
- consumption for services has improved;
- trade balance is much worse;
- there was an inventory decline;
- fixed investment has declined;
- government is only a small drag drag on GDP.
The arrows in the table below highlight significant differences between 4Q2013 and 1Q2014 (green is good influence, and red is a negative influence).
[click on graphic below to enlarge]

What the BEA says about the advance estimate of 1Q2014 GDP:
The increase in real GDP in the first quarter primarily reflected a positive contribution from personal consumption expenditures (PCE) that was partly offset by negative contributions from exports, private inventory investment, nonresidential fixed investment, residential fixed investment, and state and local government spending. Imports, which are a subtraction in the calculation of GDP, decreased.
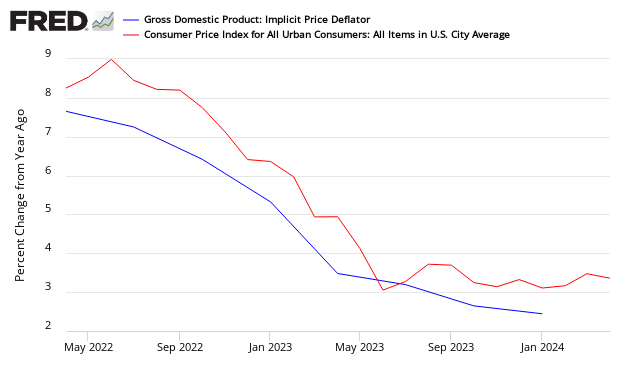
Inflation continues to moderate as the “deflator†which adjusts the current value GDP to a “real†comparable value continues to moderate. The market expected the deflator at 1.4% to 2.5% (consensus 1.7%) versus the reported 1.4%. The following compares the GDP deflator to the Consumer Price Index:

Overview Analysis:
Here is a look at GDP since Q2 1947 together with the real (inflation-adjusted) S&P Composite. The start date is when the BEA began reporting GDP on a quarterly basis. Prior to 1947, GDP was reported annually. To be more precise, what the lower half of the chart shows is the percent change from the preceding period in Real (inflation-adjusted) Gross Domestic Product. I’ve also included recessions, which are determined by the National Bureau of Economic Research (NBER).

