- The Aave price is trading near $315.51 with a 24-hour trading volume of $348,254,337.
- AAVE breakout of the $310 support level can extend the selling trend until the $292 and $270.
- Forex trading market participants may look for a bearish trade below the $325 level with a target of $310.
The AAVE/USD coin pair extended its early-day bearish moves and remained in the red zone around the $315.00 level. However, the downtrend in the AAVE coin was mainly sponsored by the mixed crypto market. AAVE price forecast remains mixed amid symmetrical triangle pattern on 4-hour chart.
Weaker Bitcoin Drives AAVE Lower to $317
The AAVE coin and other cryptos have been following the Bitcoin price movement. The BTC price started a downside correction from the $42,600 zone against the U.S. Dollar. BTC is now trading below $40,000, and it might extend losses towards $38,500.
Therefore, the AAVE has failed to extend its previous week’s gains. However, the last week’s gains in the AAVE prices were mainly sponsored by the reports. The report is suggesting that the DeFi lending platform Aave is ready to launch institutional Defi platform Aave Arc within weeks.
However, the upticks seem short-lived as the AAVE prices dropped at the starting of the new week. The Aave price is trading near $315.51 with a 24-hour trading volume of $348,254,337. Aave is fallen by 5.74% in the last twenty-four hours.
Weaker U.S. Dollar Supports AAVE/USD pair at $310
The bearish U.S. dollar is seen as one of the critical factors that lend some additional support to the AAVE/USD to limit its deeper losses.
The broad-based U.S. dollar failed to stop its early-day downward rally. It remained well in support on the day as the market’s upbeat mood tends to undermine the safe-haven dollar.
The previously released upbeat U.S. data failed to leave any positive impact on the greenback. Meanwhile, the investors held tight positions heading into a busy week highlighting monthly U.S. jobs data and a key Australian central bank decision. Thus, the losses in the U.S. dollar were seen as one of the critical factors that help the AAVE prices to cap their losses.
AAVE Price Forecast – Daily Technical Levels

AAVE/USD 4-Hour Chart
Support Resistance
297.79 320.51
283.92 329.36
275.07 343.23
Pivot Point: 306.64
AAVE/USD Forecast – Daily Technical Analysis: Choppy Range $340- $310
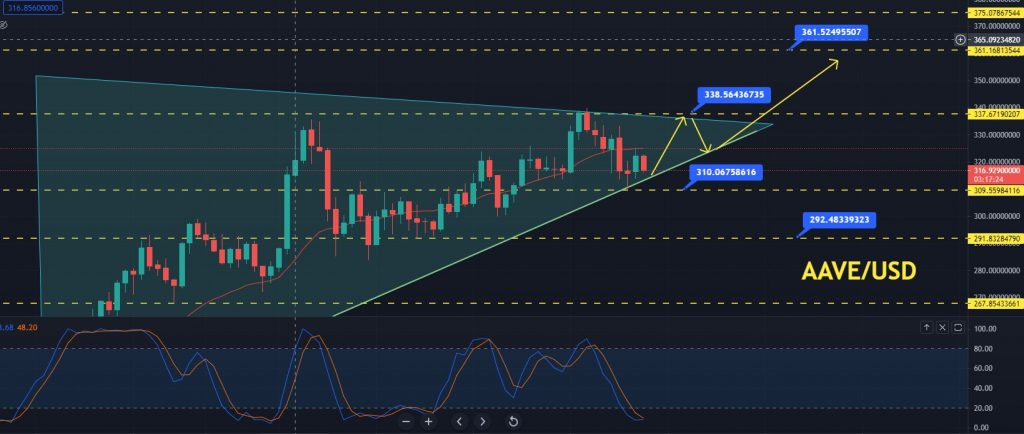
Aave price forecast is choppy on Monday as it’s trading in between a symmetrical triangle pattern. On the 4 hour timeframe, the AAVE/USD pair formed a symmetrical triangle pattern that’s supporting the pair at $310.
The breakout of the $310 support level can extend the selling trend until the $292 and $270. At the same time, the downward trendline is developing resistance at the $338 level. A double top pattern also extends this level. Therefore, a bullish breakout of this level can lead the AAVE/USD price towards the $361 level.
Speaking about the Stochastic RSI, its value has entered the oversold zone below 20. This demonstrates that sellers are getting exhausted, and soon they will start profit-taking. Therefore, failure to break below the $310 level can trigger buying trend until $338.
AAVE/USD has crossed below the 50 EMA (Exponential Moving Average – Red Line) support level of $325. Below this, the AAVE/USD has a strong chance of continuing the bearish trend.
Forex trading market participants may look for a bearish trade below the $325 level with a target of $310. Alternatively, buy trades can be taken above the $310 level to target $338. All the best!
Looking to buy or trade crypto now? Invest at eToro!
Capital at risk


