 Image Source:
Every so often we need a reminder that even the most bullish of markets is susceptible to pullbacks. We got one yesterday. The CPI report forced investors to reconsider an over-optimistic rate-cut narrative. And woke up from its stupor. yesterday morning, the proximate cause for the decline was a set of higher-than-expected CPI statistics, most notably monthly headline and core readings that were 0.1% above the consensus. By itself, a modestly higher reading in an inflation statistic that is not even the Federal Reserve’s preferred measure (that’s Core PCE, not CPI) should not have caused a significant reaction in a wide range of asset prices. However, the market persisted in expected more rate cuts than the Fed seemed willing to offer. That changed dramatically yesterday. After the December FOMC meeting, when Chair Powell acknowledged the likelihood for a “pivot”, which was bolstered by a “dot plot” that projected three rate cuts for 2024. Yet Fed Funds futures, which were already pricing in that number of cuts, almost immediately doubled those expectations. As we wrote in mid-January, in a piece entitled “”:
Let’s examine the current situation. Fed Funds futures are pricing in at least six rate cuts for 2024, with a roughly 60% chance for a seventh by December. Meanwhile, according to a recent report by FactSet, analysts are projecting earnings growth of 11.8% and revenue growth of 5.5% for the S&P 500 (SPX) for calendar year 2024. Ask yourself whether both predictions can simultaneously be true.
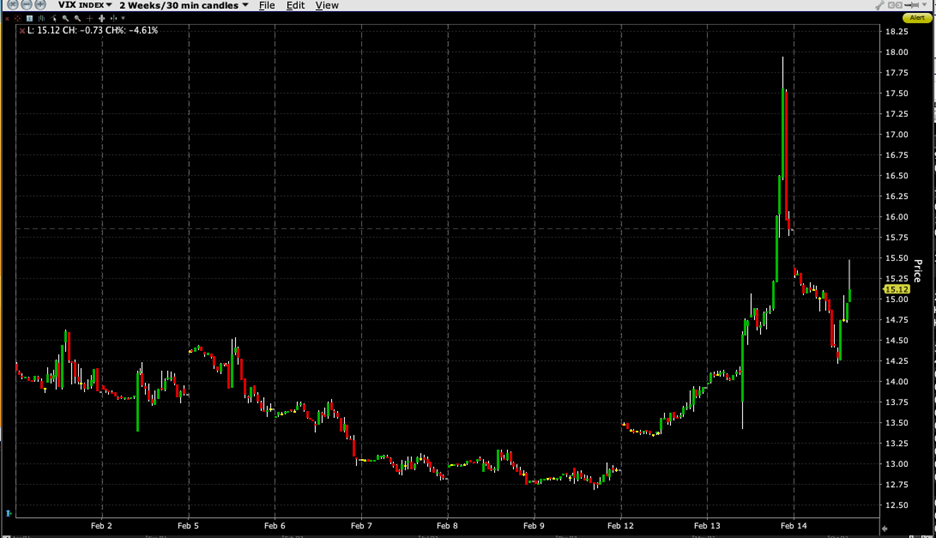
To be sure, rate cut expectations have been diminishing since the January 31st FOMC meeting. Prior to that meeting, there was a 43% chance for a 25bp cut in March, cuts fully priced in for May and June, and between five and six priced in for 2024. On Monday, those expectations had shrunk to 18% for March, 69% for May, a cut fully priced for Jun, and between four and five for the year. By this morning, although a cut remains priced in for June, the March and May expectations have dipped to 11% and 45% respectively, with just under four cuts priced in for 2024.While the jolts to the yield curve and major indices were quite notable yesterday, to my mind, the resurgence in the Cboe Volatility Index (VIX) provided the most interesting reaction. As recently as Monday, VIX was trading below 13. At the time of peak declines yesterday, VIX flirted briefly with 18. This should provide a wake-up call to those who doubt the rationale or the efficacy of hedging. Even though VIX has pulled back from its panicky peak, the fact that it remains above 15 today tells us that institutional investors may have remembered that hedging is sometimes a desirable thing.
VIX Month-to-date 30-Minute Candles
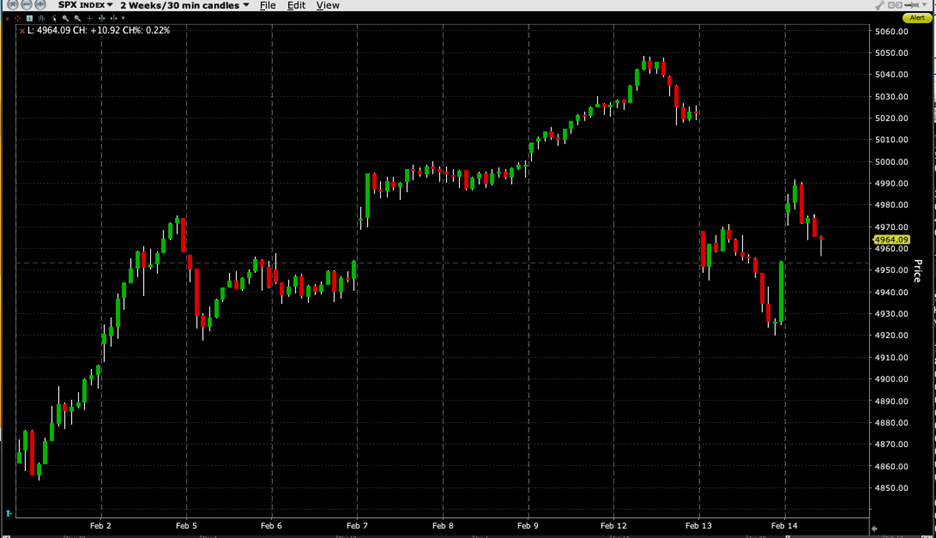
(Click on image to enlarge) Source: Interactive BrokersThe chart above shows the sideways to downward moves in VIX that had prevailed so far this month – until yesterday. Meanwhile, the chart below shows that despite yesterday’s damage, the S&P 500 () remains solidly higher on a month-to-date basis. The index bounced off the 4920 level, where the last mini-selloff ended, though an early rally today seems to be losing steam.
SPX Month-to-date 30-Minute Candles
(Click on image to enlarge) Source: Interactive BrokersWith a monthly options expiration this week and , both of which can bring volatility (especially NVDA), it seems opportune to remember that volatility is no different than any other asset – buying low and selling high tends be a useful strategy. More By This Author:Who’s Zoomin’ Who? (NVDA Edition)The Underappreciated Role Of Zero-Dated Options In The Current Rally From T+1 To Artificial Intelligence

