 Image Source: Gold looks like it’s correcting right now, although the longer-term prospects look better than ever. In fact, it seems that the entire financial universe is aligning in favor of gold.Gold’s lost about $40 over the past couple of sessions, after setting yet another all-time high and threatening to close above $2,700 on a spot basis.Frankly, it looks like this bout of weakness could last a while. Let’s take a look at why.As you may remember, in early July, I showed you a chart showing how, during this nascent , price breakouts had been reliably predicted whenever its Bollinger bands narrowed.As a bit of background, Bollinger bands are a measure of volatility, with the center line marking the 20-day moving average, while the upper and lower bands typically mark two standard deviations above and below that average. When the price is near the upper band, it signals that an asset is overbought (and perhaps due for a correction), and vice versa for the lower band.Another way to use this tool is to find times when, as I noted above, the bands “pinch.” This shows a period of low volatility and consolidation during an established trend and often presages an imminent breakout, usually in the same direction as that trend.That’s why I showed you the chart in early July: The bands were narrowing and thereby predicting a price rally that, during the middle of summer, would surprise just about everyone.Just as predicted, we saw gold take off, and, again, as predicted, everyone was stunned. Except you, of course.
The Other Side of the Coin
Take a look at that same chart of gold and its Bollinger bands, updated for today’s values: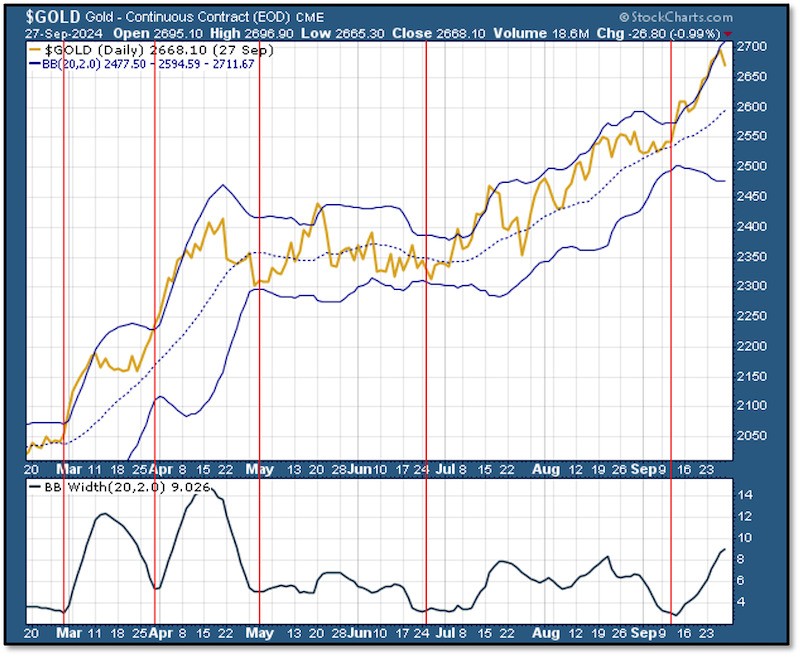 As you can see, we had another chance to buy gold when the bands pinched a few weeks ago, and, since then, gold has been riding the upper band higher.Now that rally has lost steam, and the bands are, just barely, starting to come together again. The record of this bull market shows that the process of narrowing has so far taken anywhere from one to three weeks, so we could see some continued price weakness.The good news is that, from a fundamental standpoint, everything seems to be turning in favor of gold.
The Investing Universe Aligns
First, we had the Fed pivot, which the markets began to price in early in July (resulting in the aforementioned ). Consider this chart of gold and the Dollar Index, with the DXY scale inverted.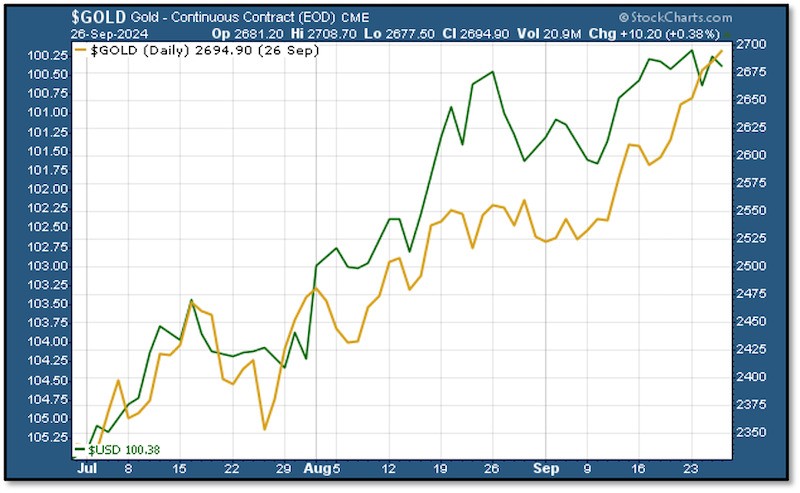 The contestants on Dancing with the Stars wish they could move in such unison. To sum up, in anticipation of the Fed’s move from rate hiking to the rate cutting side of the cycle, investors began to buy gold and sell the dollar. We’ve also seen option interest in gold futures rise along the way, as many traders functionally adopted a pair trade strategy with gold and the dollar.They did other things, as well, moving into the gold ETF, buying U.S. equities, and, more specifically, beginning to move into gold mining stocks to gain leverage to the metal’s powerful rally.Thus, the Fed pivot has been the biggest fundamental factor working in gold’s favor. But there have been other ingredients added to the gumbo in recent days, notably the slashing of bullion import tariffs by India and a series of significant monetary and fiscal . As I’ve often said, a hallmark of a bull market is when even bearish developments are interpreted bullishly. But this is taking things to an entirely new level, as it seems every major new development is undeniably bullish for gold.The bottom line is that we’re in a long-term, secular bull market for gold. And we need to be positioned for it.More By This Author:Rate Cuts Point To Major Stock Market Decline The Dollar Is Smoke And Mirrors Feelings Trump Economics: Price Gouging Edition
A Bull Market Break

