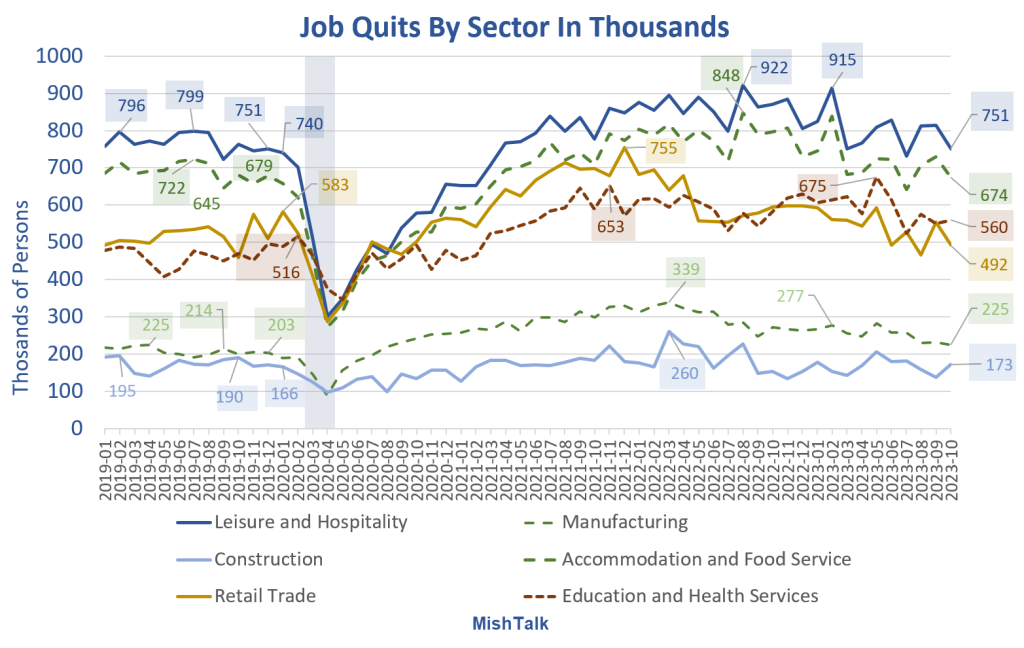
(Click on image to enlarge) Job quits from the BLS Job Openings and Labor Turnover (JOLTS) report, chart by Mish.Quits Synopsis
Quits Declines from Highs
Education and Health ServicesWhy the BLS groups Education with Health Services is a mystery, but the reason this sector still has an elevated number of quits is no mystery.The Health Services industry provides health care and social assistance for individuals. It is mostly a low-pay sector, with lots of emotional stress. Aging demographics also means the average care worker is taking care of more people.Other JOLTS DataLet’s now take a look at the latest .
The number of job openings decreased to 8.7 million on the last business day of October, the U.S. Bureau of Labor Statistics reported today. Over the month, the number of hires and total separations changed little at 5.9 million and 5.6 million, respectively. Within separations, quits (3.6 million) and layoffs and discharges (1.6 million) changed little. This release includes estimates of the number and rate of job openings, hires, and separations for the total nonfarm sector, by industry, and by establishment size class.
Openings
Job Openings On the last business day of October, the number of job openings decreased to 8.7 million (-617,000). The job openings rate, at 5.3 percent, decreased by 0.3 percentage point over the month and 1.1 points over the year. Over the month, job openings decreased in health care and social assistance (-236,000), finance and insurance (-168,000), and real estate and rental and leasing (-49,000). Job openings increased in information (+39,000).
Hires
Hires In October, the number and rate of hires changed little at 5.9 million and 3.7 percent, respectively. The number of hires decreased in accommodation and food services (-110,000).
Separations
Separations Total separations include quits, layoffs and discharges, and other separations. Quits are generally voluntary separations initiated by the employee. The quits rate can serve as a measure of workers’ willingness or ability to leave jobs. Layoffs and discharges are involuntary separations initiated by the employer. Other separations include separations due to retirement, death, disability, and transfers to other locations of the same firm.
Separations Details
Professional and Business Services(Click on image to enlarge)
I show a jump in professional and business services quits as well, but the decline from the top is 858 to 688, a 19.8 percent decline.I will add that line to my chart next month. I suspect this jump is an outlier or seasonal adjustment silliness.In general, even the seasonally adjusted numbers are choppy.Job Openings, Hires, Separations, Quits(Click on image to enlarge)
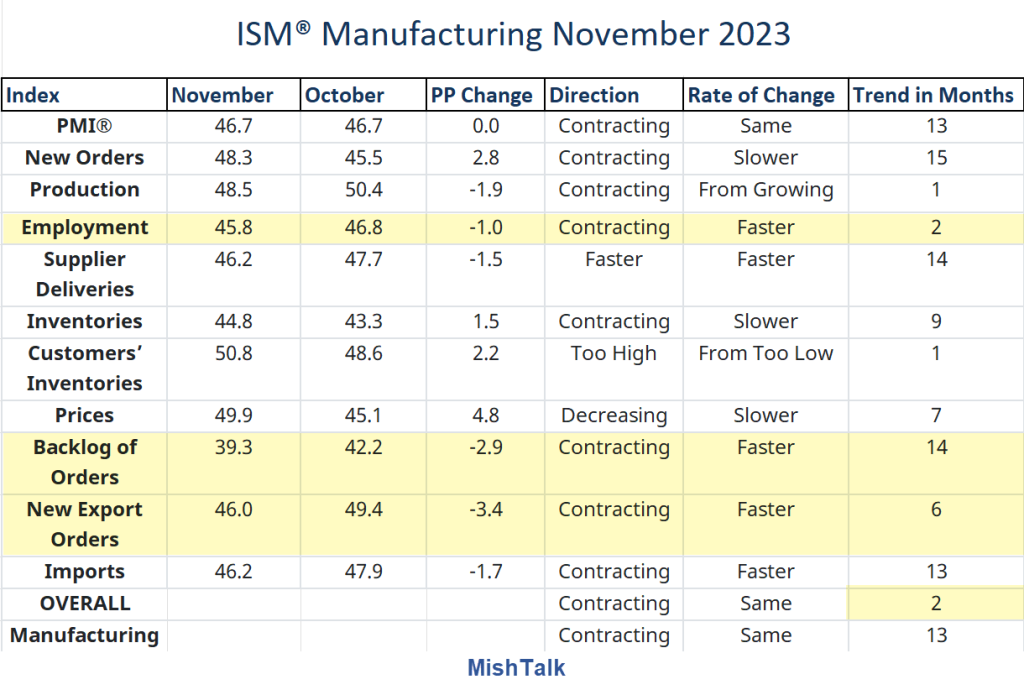
Job openings have plunged steeply but remain well above pre-pandemic estimates assuming you believe this soft data, and I don’t.Regardless, it’s actions that matter (quits and hires), not openings.Total quits have nearly returned to pre-pandemic levels. Education with Health Services accounts for much of the difference.The labor markets have mostly returned to normal. The only debate is over what’s next.Nirvana?If you believe in the soft landing theory, we will now live happily ever after.I don’t. Portions of the economy are severely distressed including commercial real estate and manufacturing.ISM Manufacturing Contracts for the 13th Consecutive Month, Order Backlogs Plunge(Click on image to enlarge)
Image and excerpts by permission and courtesy of the Institute for Supply ManagementThe ISM manufacturing report for November is dismal. The headline number didn’t change but details look worse.For discussion, please see .Manufacturing is a bigger portion of the economy that widely believed. It creates the goods that consumers buy.And in the services sector, prices have risen 78 consecutive months according to the ISM.For discussion, please see Residential housing is stressed in a different way.Home Prices Hit a New Record High According to Case-ShillerThanks to Fed policy, existing-home sales are in the gutter and likely to remain so. Yet, prices are in the stratosphere.For housing discussion, please see This is not a Nirvana setup. The Fed is walking a tightrope. The only questions are when and how the Fed makes another policy error and in which direction.Everyone but the Nirvana believers are speculating on that. I sure don’t know. And no one else does either.More By This Author:Germany’s Commitment To End Coal By 2030 Is A Never Ending Shell Game Factory Orders Look Grim In October Down 3.6 Percent, What’s Going On? Huge Moves In The Yield Curve This Year, What’s Going On?

